Uber vs. Lyft: Which Is Cheaper in Each State and City?
Nobody likes to think too hard about Uber and Lyft. But a moment of extra thought might just save you a few bucks.
They’re the guilty pleasures — luxuries, in some cases — that we indulge in to make life easier. ‘Transport Network Companies’ (TNCs) take the awkwardness and, in theory, uncertainty out of hailing a ride. Even if you suspect that your old friend, the local cab, might be cheaper, bringing up a rideshare app lets you see in an instant how long you’ll wait, how much it costs (go green for a few extra cents!) and even where your driver’s at.
And when you’re in a strange city or state, Uber or Lyft are the McDonald’s of getting around: the app is the glowing arches, you’ve got the ordering ritual down, and you know more or less what it’s going to taste like wherever in the country you are.
But for now, at least, there are humans and other variables involved in the process, and sometimes, there’s an inconvenient surprise in store. The wait time is long. The price is way over what you expected. Sure, you can switch from the Uber app to Lyft or vice versa, but meanwhile, you’ve wasted precious screen time.
To help you figure out which app to start with, CashNetUSA has tested the services in 150 big cities across the States and can reveal which service is generally cheaper in these cities and every state.
What We Did
CashNetUSA used Uber and Lyft’s online fare estimators to calculate the average fare for a six-mile journey in the 150 most populated cities in the U.S. and compared the cost in each one. Our state rankings reflect the average cost across each state’s three most populated cities, while our city rankings consider the 50 most populated; all 150 are included in the interactive table toward the bottom of the page.
Key Findings
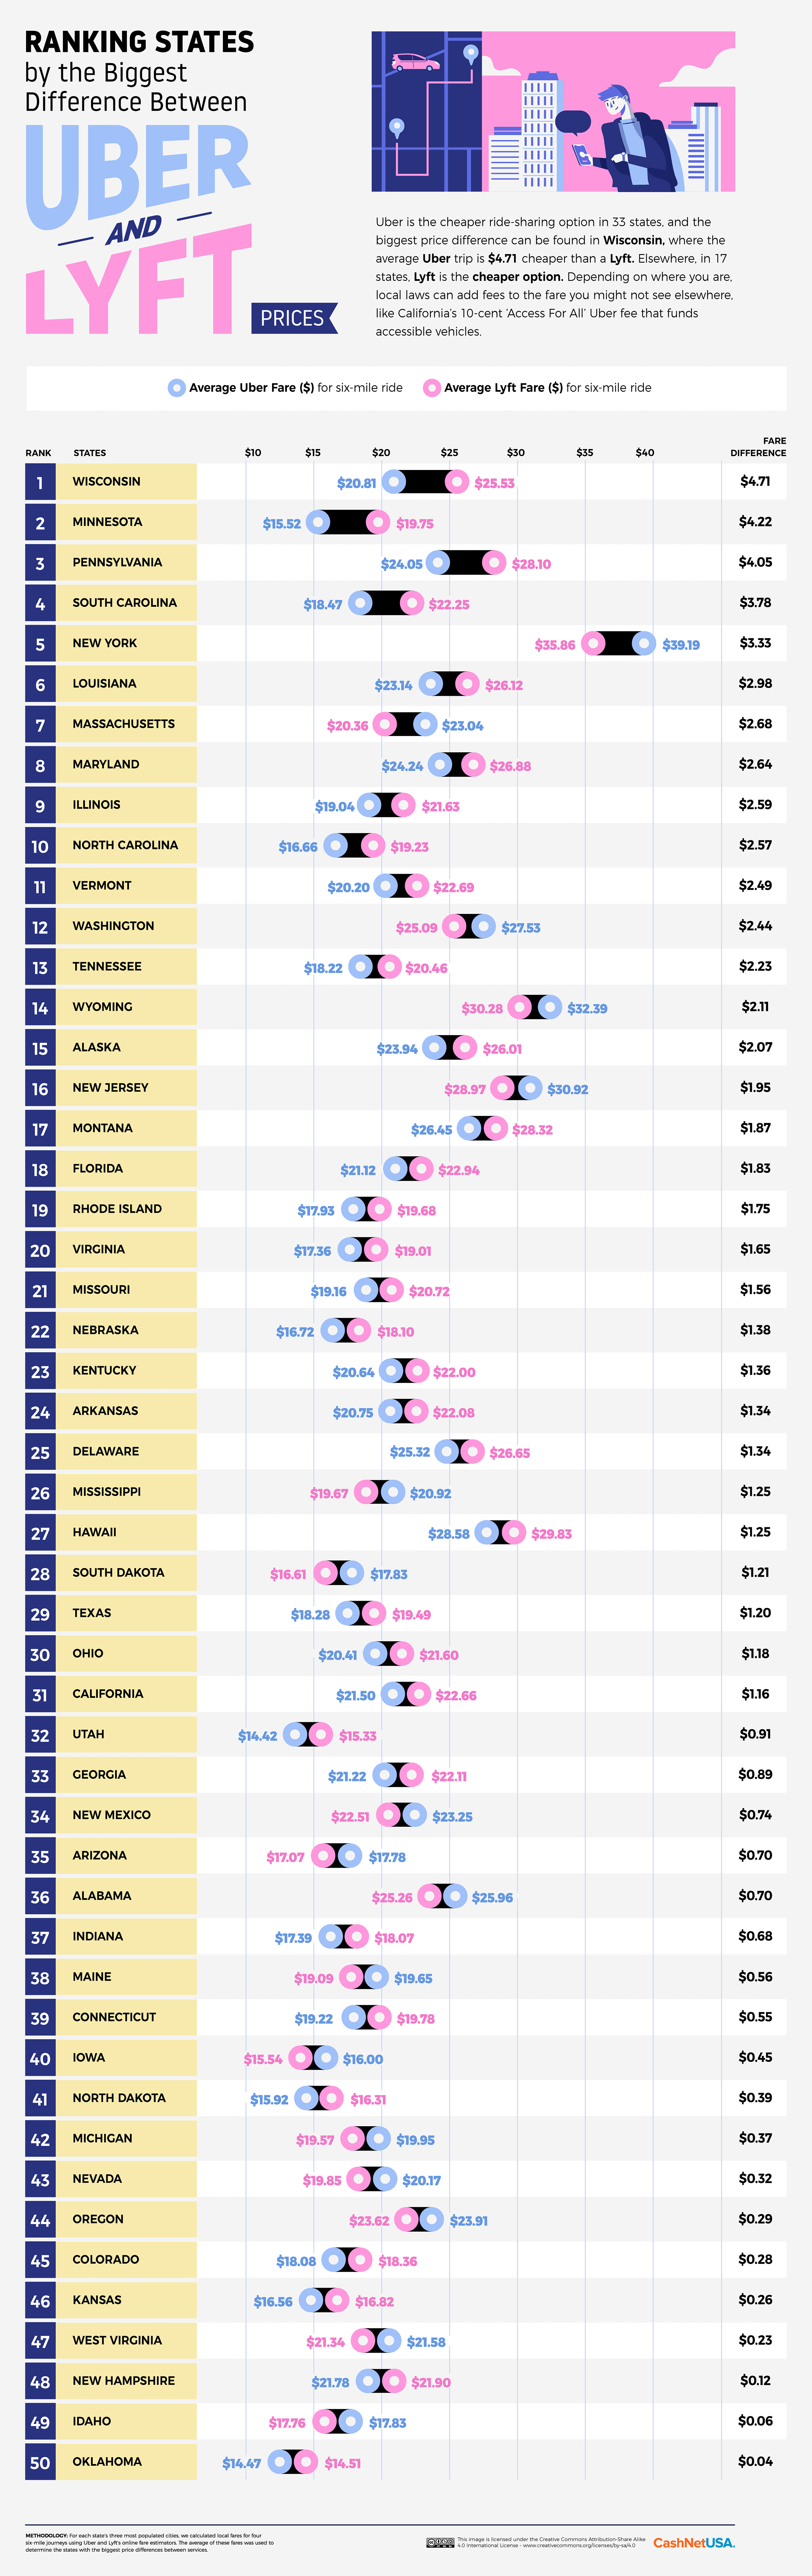
- Wisconsin is the state with the biggest gap between companies: a six-mile ride costs $4.71 less with an Uber.
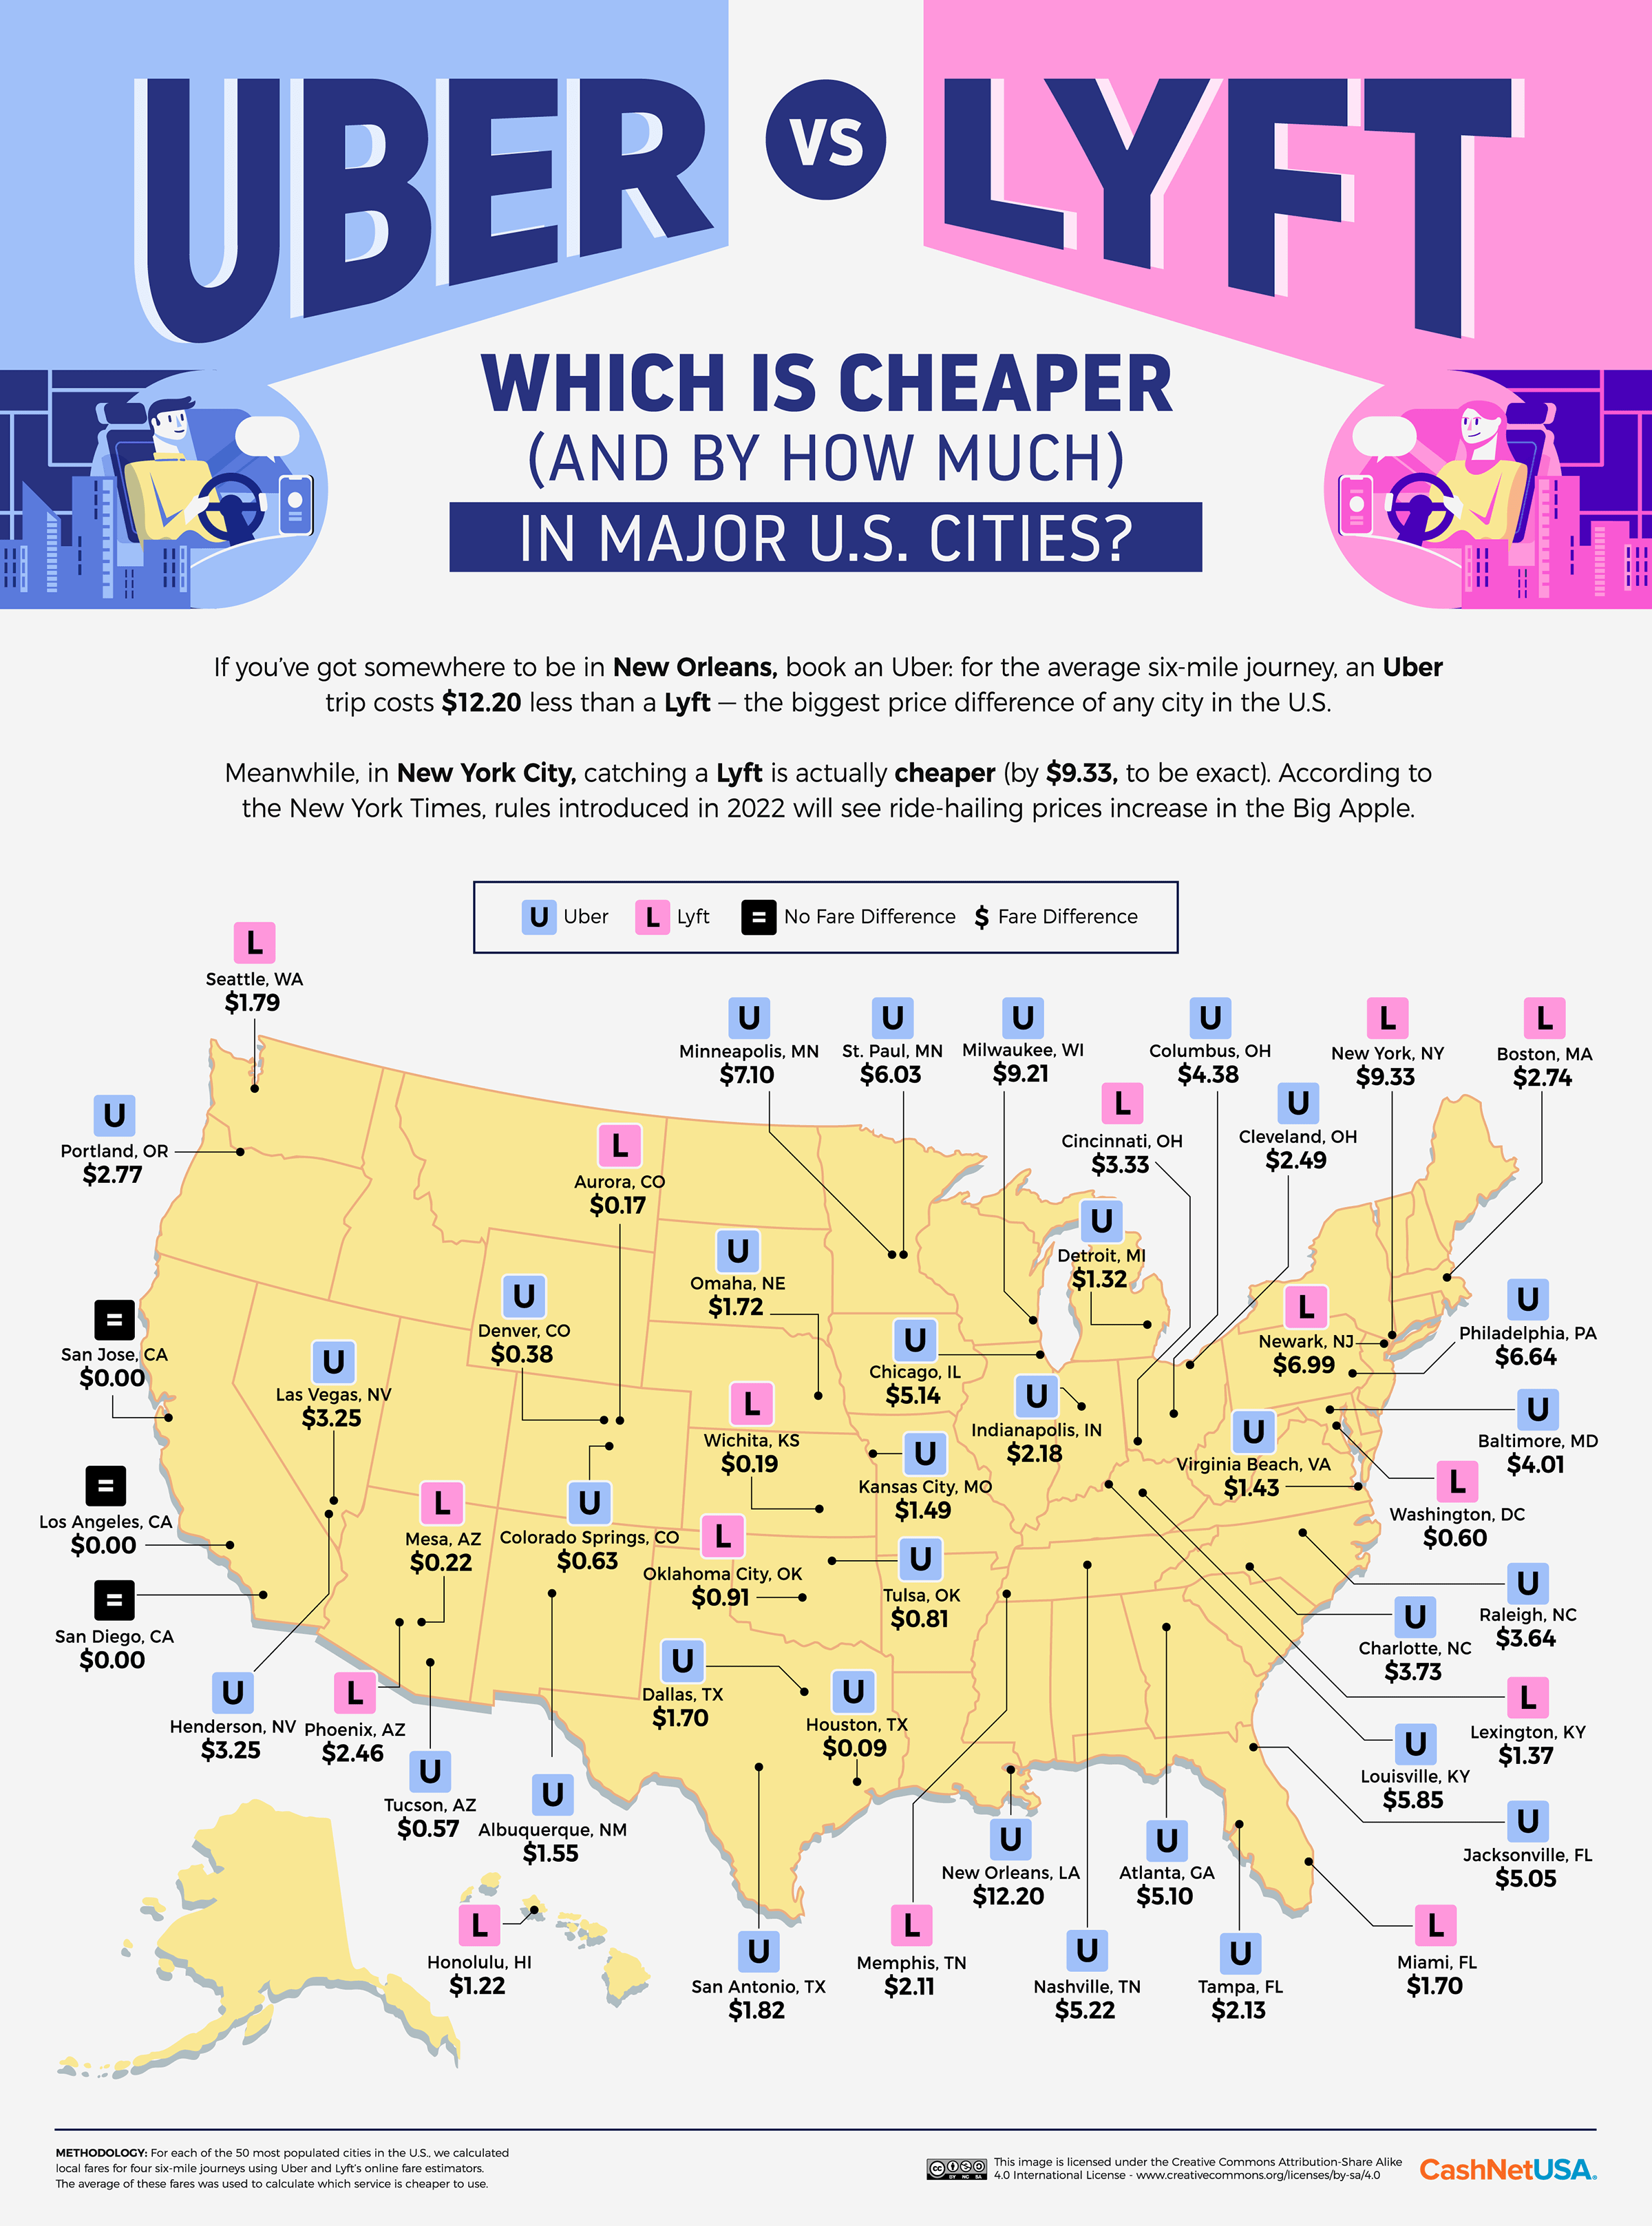
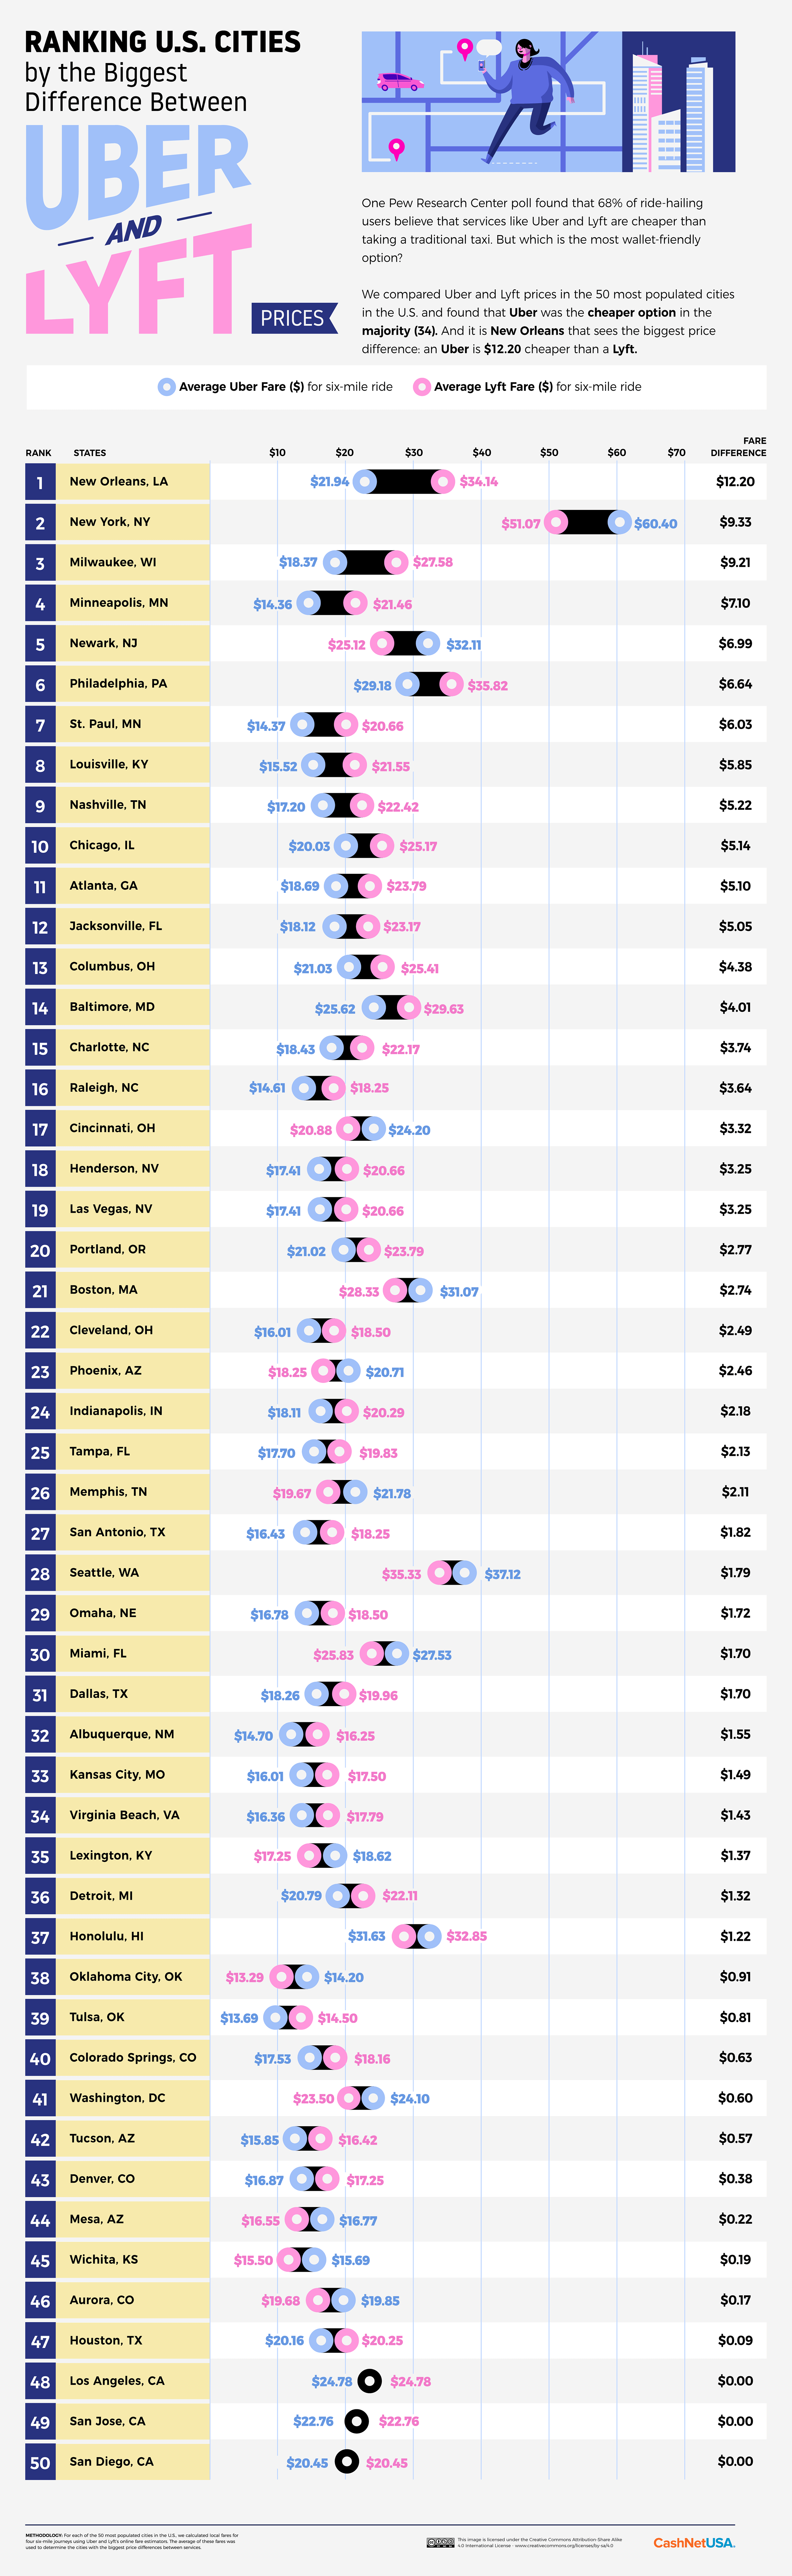
- Uber is $12.20 cheaper than Lyft in New Orleans, LA, the biggest disparity at city level.
- Lyft is cheaper by $9.33 in New York City.
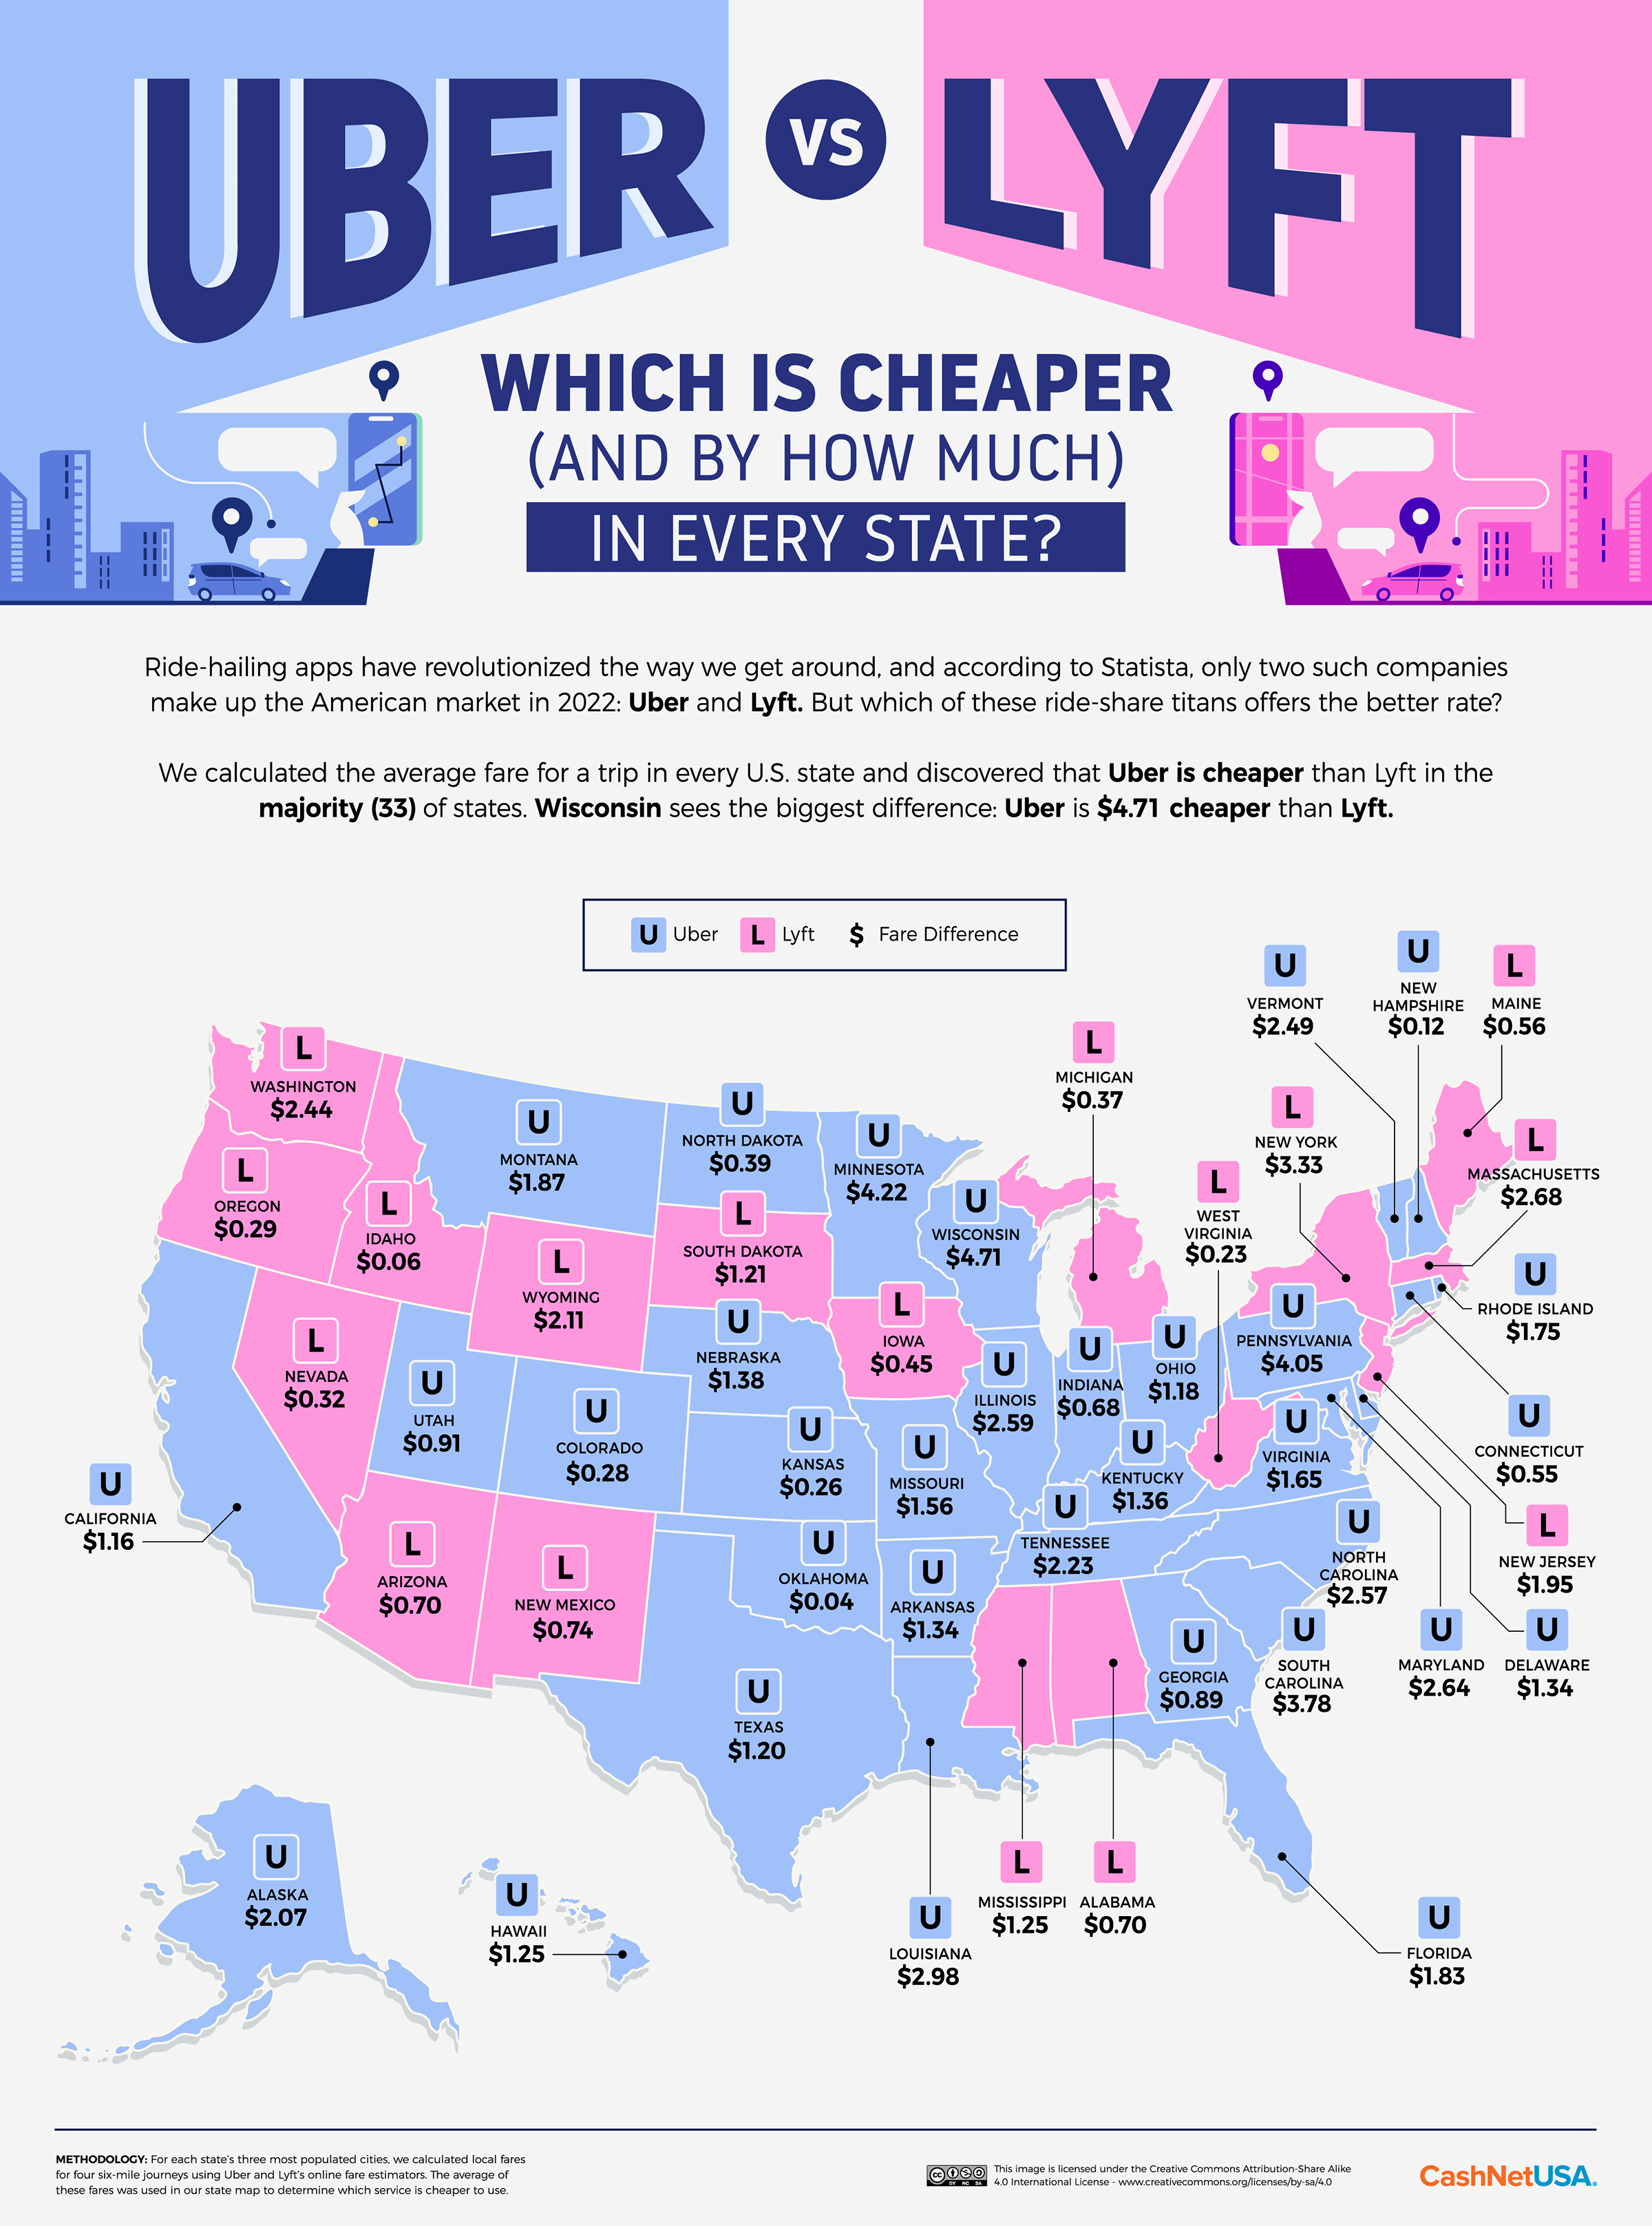
Uber is the Cheaper Option in Two Out of Three States
Uber is cheaper than Lyft in 33 states, with Lyft’s cheaper states clustered in the west and northeast of the country. In Wisconsin, Minnesota and Pennsylvania, Uber is cheaper by more than $4, while Lyft’s advantage is strongest in the state of New York, where the service is cheaper by $3.33 on a six-mile trip. New York is also the state with the most expensive fare in the country, at $39.19 for a six-mile Uber.
Click here to see the image in full size
Oklahoma has the cheapest Lyft ($14.51), but the local Uber costs 4 cents less. This is the smallest difference for any state. Utah has the cheapest Lyft ($14.42), and in this case, it is a significant saving of 91 cents against the local Uber. For shorter journeys, Lyft has partnered with Spin e-scooters in the Utah capital, Salt Lake City, which cost $1 to unlock plus 42 cents per minute, taxes and fees. The following chart illustrates the extent of the price difference in every state.
Click here to see the image in full size
Both rideshare companies are based in California, where it is $1.16 cheaper to take an Uber rather than a Lyft. But rideshare culture has been controversial in the companies’ home state, with California’s Proposition 22 exempting drivers from employee status — and net minimum wage — at the firms’ recommendation. One study found that the average rideshare driver in California makes an hourly wage of $6.20 once their costs are deducted.
The New Orleans Rideshare Service that Costs 55% More
Echoing the results at state level, Uber is cheapest in 34 out of the 50 (68%) most populous cities in the map below. However, Lyft fares a bit better when the top 150 cities are included (Uber’s share drops to 60%). The biggest difference is in New Orleans, LA, where it costs a whopping $12.20 more to take a Lyft — a hike of 55.6%. Since taxi rides in New Orleans are still calculated at a flat rate, it often makes more sense to get a local cab in busy times than to depend on a rideshare that is subject to surge pricing.
Click here to see the image in full size
New York City boasts the most expensive ride shares, and you’ll pay $9.33 more for an Uber over a Lyft on a six-mile trip. Both companies exempted NYC from nationwide fuel surcharges early in 2022, but the city remains a dynamic market. Industrial action by drivers and the lingering effects of artificially inflated permit prices, which, along with Covid, have kept over half of the city’s regular cabs off the road, means getting a ride is never a sure thing in NYC.
Click here to see the image in full size
How much would you pay to save a few minutes of wait time? Some 36 of the biggest 50 cities have a difference of under five bucks between the two services, so you could effectively double your chances of getting a quick ride if you’re open to both Uber and Lyft. The difference is smallest in Houston — perhaps because of an overriding sense of human decency among the rideshare community: “It was Christmas Day 2019 when I picked up a family of three heading home,” reports Houston Lyft driver Shelly Castle. “When I dropped them off, they asked me if I wanted a to-go plate of food from their Christmas dinner.”
The Established Kids on the Block
Basic Uber and Lyft pricing is pretty even, but regional variations occur due to supply and demand. Each company calculates surge pricing in a different way, and places with fewer drivers with one or the other firm will feel demand more intensely during busy periods. It’s wisest to check both services if you have time and credit, but when you’re in a pinch, then knowing which company tends to offer cheaper rides locally could save you the price of a coffee. You can check our full list of cities and states in the interactive table below.
The rideshare business model has been controversial as the popularity of Lyft and Uber have snowballed over the past decade. And since the companies have drivers, riders and authorities to keep happy — not to mention environmental campaigners — while touting a service that’s predicated on seamless convenience, that controversy is unlikely to dampen soon. And unfortunately, the services are unlikely to get cheaper.
METHODOLOGY & SOURCES
We first curated a seed list of the three most populated cities in each state and Washington, D.C.
Official Uber and Lyft fare estimators were used to calculate the average price of four six-mile journeys in each city, starting from the geographic center of the city and to a point in each of the four directions (north, south, east and west). The endpoint for each of the four journeys was calculated using NOAA’s Latitude/Longitude Distance Calculator, which estimates “as the crow flies” distance based on Great Circle Distance between two points on a sphere. For each journey in each city, the fare estimates were taken at three times of day to account for fare differences that arise due to congestion and traffic.
For both Uber and Lyft, the basic ride types were used, which are respectively UberX and Lyft. For Lyft fares, which are typically returned as ranges (e.g., $20-$25), the midpoint of each estimate was taken.
For cities where the Uber fare estimator didn’t return estimates (San Jose, CA; Los Angeles, CA; San Diego, CA; Las Vegas, NV; and Henderson, NV), fares were calculated manually using official Uber and Lyft fare parameters (base fare, booking fee, minimum fare, per minute and per mile) for those cities.
In calculating these estimates, the time it would take to complete a six-mile journey was estimated using typical traffic speeds on secondary roads without congestion, with mild congestion and with severe congestion, based on this study to replicate the process of fare estimation at three different times of the day.
State-level estimates were calculated as averages of city-level estimates of the three cities in each state.
The data was collected in November 2022.