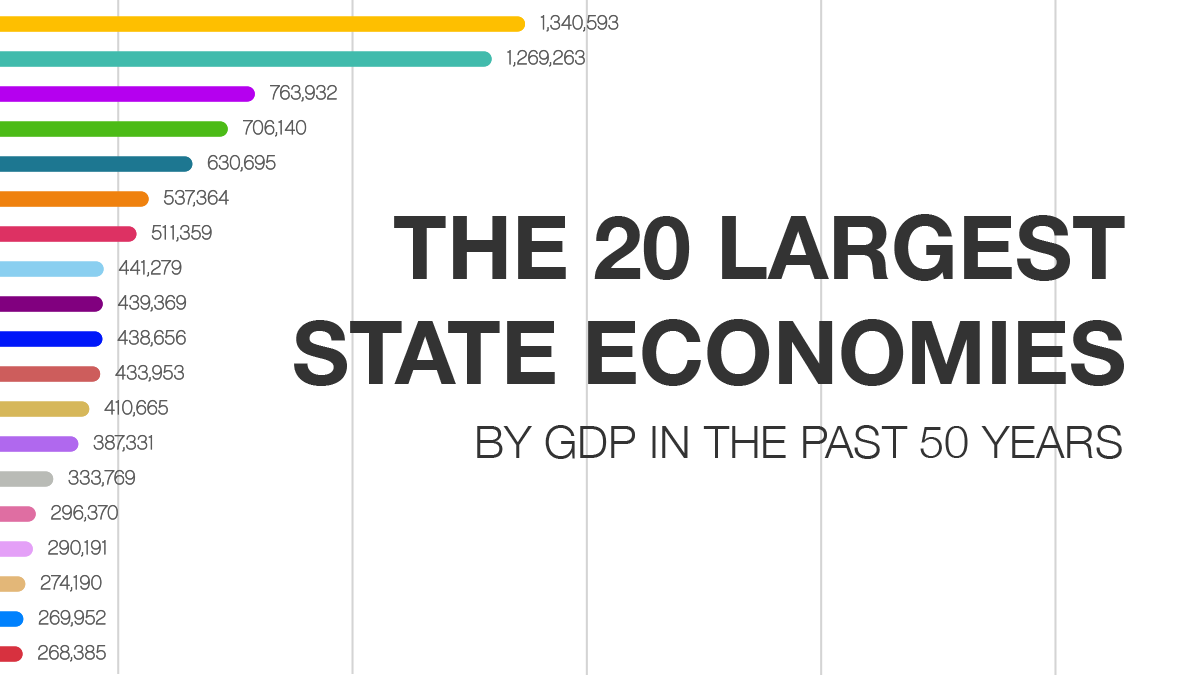
The 20 Largest State Economies by GDP in the Past 50 Years
The U.S. economy has roughly quadrupled in size over the past five decades, growing from a GDP of $4.6 trillion in 1967 to $18.6 trillion today.[1] While at the national level the U.S. economy has experienced fairly consistent growth over the last 50 years, state-level economic change has been far more dynamic.
To discover how the economic geography of the United States has changed, CashNetUSA analyzed the real GDP of the 20 largest state economies from 1967 to 2017 using inflation-adjusted data from the U.S. Bureau of Economic Analysis.
Major economic trends of the past 50 years
The major economic trends of the last 50 years include both long- and short-term changes that have significantly altered the domestic economic landscape. One of the major shifts in the industrial composition of the U.S. economy is the shift from the manufacturing to the service sector. Employment in manufacturing fell from 27.1% of the U.S. workforce in 1967 to 8.5% as of 2017, while the service sector rose from 66.8% to 86.3%.[2] Partially as a result, much of the Rust Belt — a collection of manufacturing-heavy cities and states in the Midwest and Northeast — have struggled economically over the past five decades.[3] Michigan, for example, fell from the sixth largest state economy in 1967 to the 14th largest in 2017. Factors that contributed to deindustrialization in America include increased competition from Asian steel-producing countries, the two oil price shocks of the 1970s and trade liberalization.[4]
One of the most important trends of the last 50 years was the growth in the Sun Belt region of the United States, a stretch of the Southeast and Southwestern part of the country characterized by a warm and sunny climate, low cost of living and low unemployment.[5],[6] Population growth contributed to rapid economic expansion in a number of states.[7] Arizona rose from the 33rd largest state economy by GDP in 1967 to the 17th largest in 2007, and in 2006 Texas surpassed New York as the nation’s second largest economy.
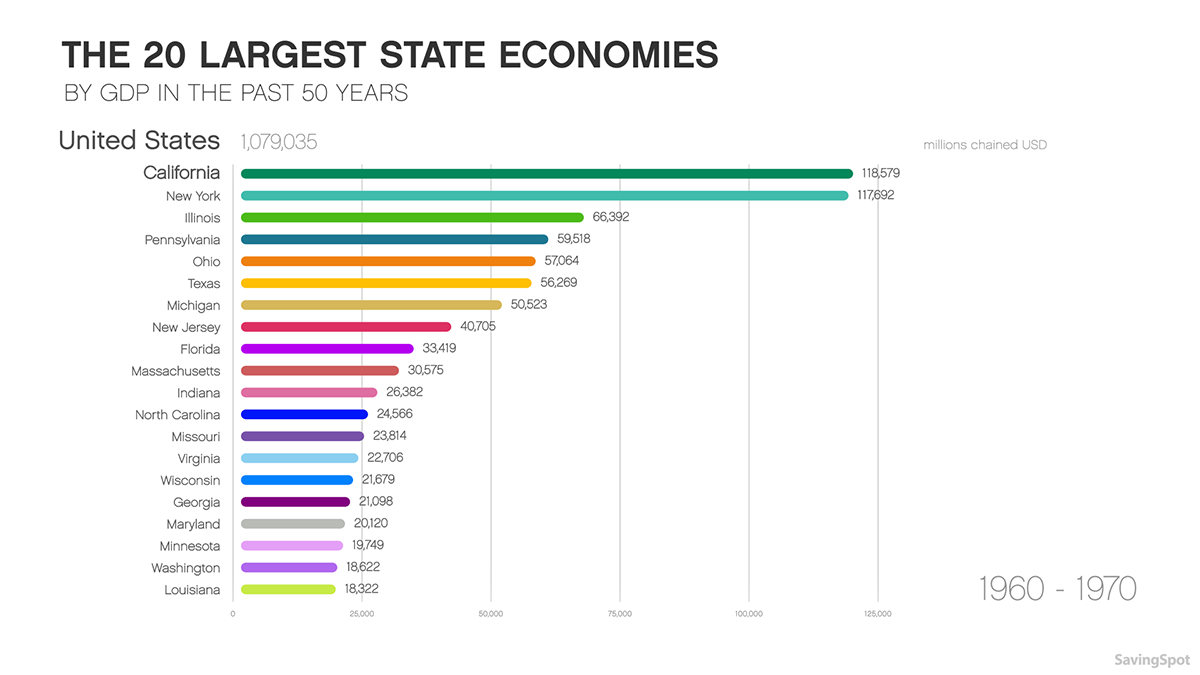
1960s – Post WW-II growth
The 1960s were characterized by rapid economic growth and a marked increase in real wealth for a majority of Americans.[8] From 1959 to 1969 U.S. GDP rose by 55.5%, the greatest 10-year increase of the last six decades..[9]
The long streak of postwar economic expansion was largely the result of increased labor productivity, particularly in manufacturing and agriculture, and rising federal expenditure on Great Society programs such as Medicaid and Medicare — as well as the Vietnam War.[10,11,12] While the increased deficit spending was able to keep the U.S. economy recession-free for nearly a decade, inflation began to rise towards the end of the 1960s, and would ultimately contribute to the end of the postwar economic boom in the 1970s.[13]
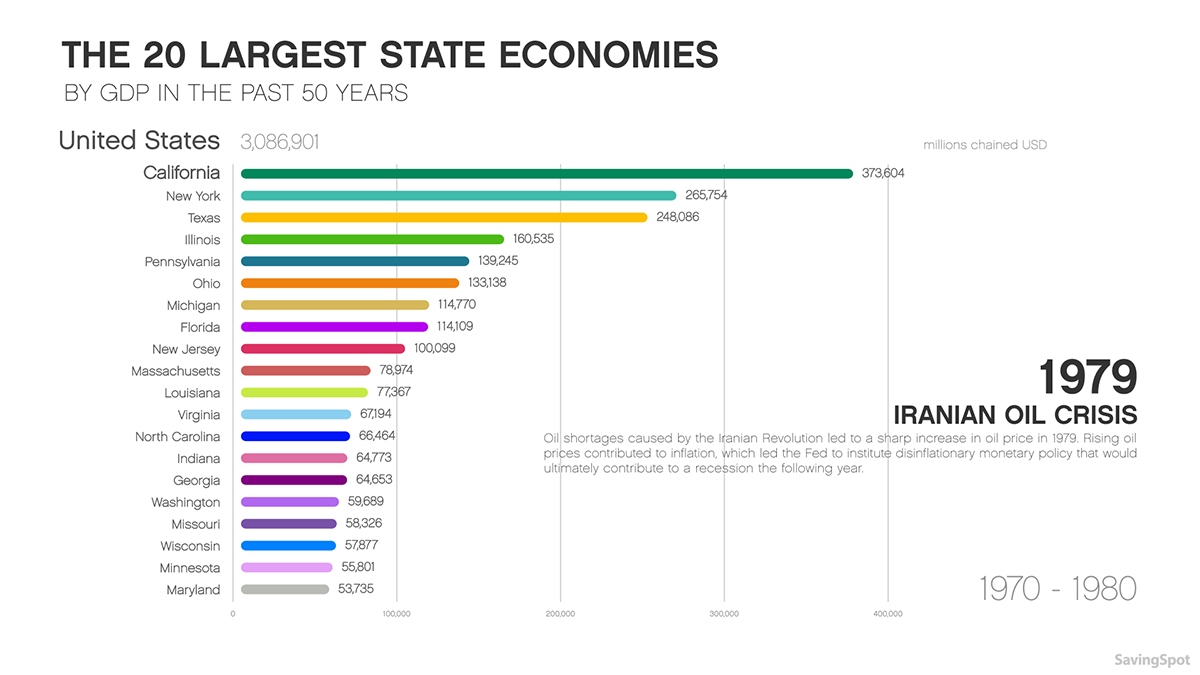
 1970s – Competition from Asia
The 1970s were largely marked by increased competition from newly industrialized countries in Asia, a continued shift in the domestic economy from manufacturing to the service sector and a recession that ultimately signaled the end of the post-WWII era of rapid economic growth.[4],[14] The recession was induced by a 1973 oil embargo by Arab members of OPEC on exports to the U.S. and other allies of Israel that led oil prices to quadruple and lasted from November 1973 to March 1975.[15],[16] High oil prices, as well as an influx of cheap steel from China and other Asian nations, led to an economic slowdown in steel-producing states throughout the Rust Belt.[17],[18] Towards the end of the decade, manufacturing-dependent states such as Michigan, Indiana and Ohio lagged behind the nation as a whole in GDP growth. The 1970s ended the same way the decade began – with an oil price shock that contributed to a multi-year recession.[13]
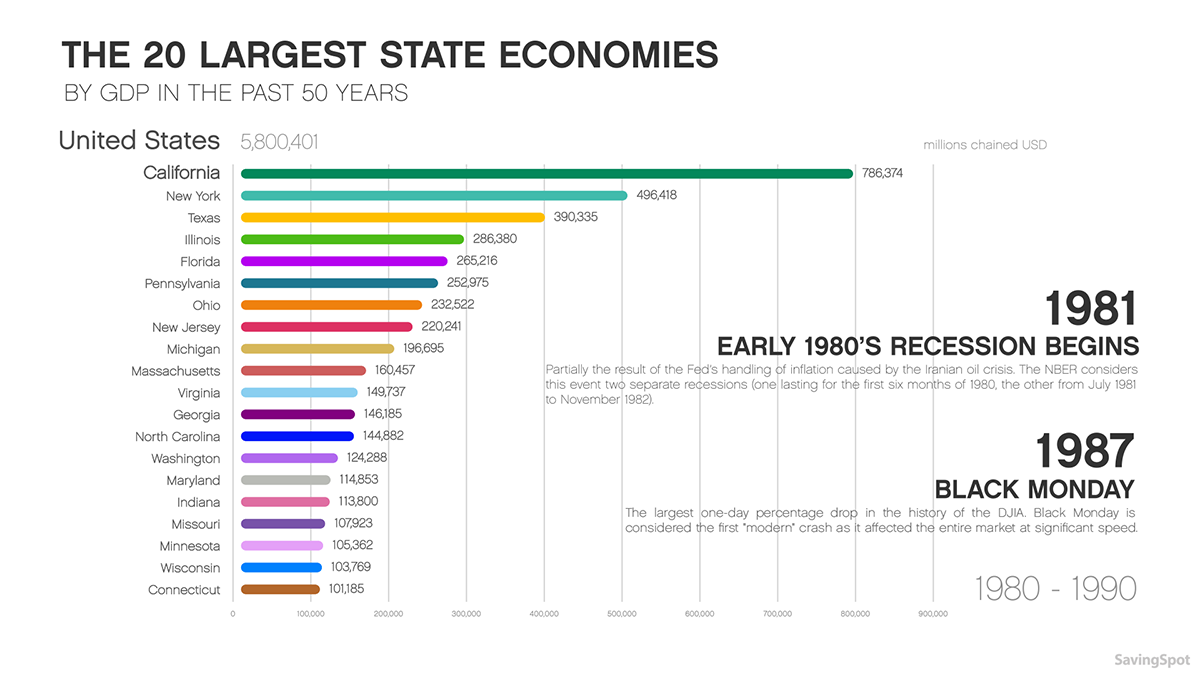
 1980s – From recession to growth
The 1980s began with a recession and ended with relatively strong economic growth.[13] The recession was induced by oil shortages caused by the 1978-79 Iranian Revolution and was exacerbated by the Federal Reserve instituting disinflationary monetary policy in response to the price shock.[19] Throughout the decade, Sun Belt states such as Arizona, Nevada, Florida, California and Georgia experienced substantial population growth, offering new residents warmer climates, low cost of living and economic opportunity.[5],[6],[7] Georgia began a period of rapid economic expansion, outpacing the U.S. as a whole in annual population growth throughout the decade and rising from the 15th largest state economy by GDP to the 12th largest.
On a Monday in October 1987, the stock market went through the largest one-day percentage drop in the Dow Jones Industrial Average in history.[20] Known as Black Monday, the event is considered the first “modern” stock market crash for its speed and reach across the entire market.[21]
 1990s – The longest period of expansion ever
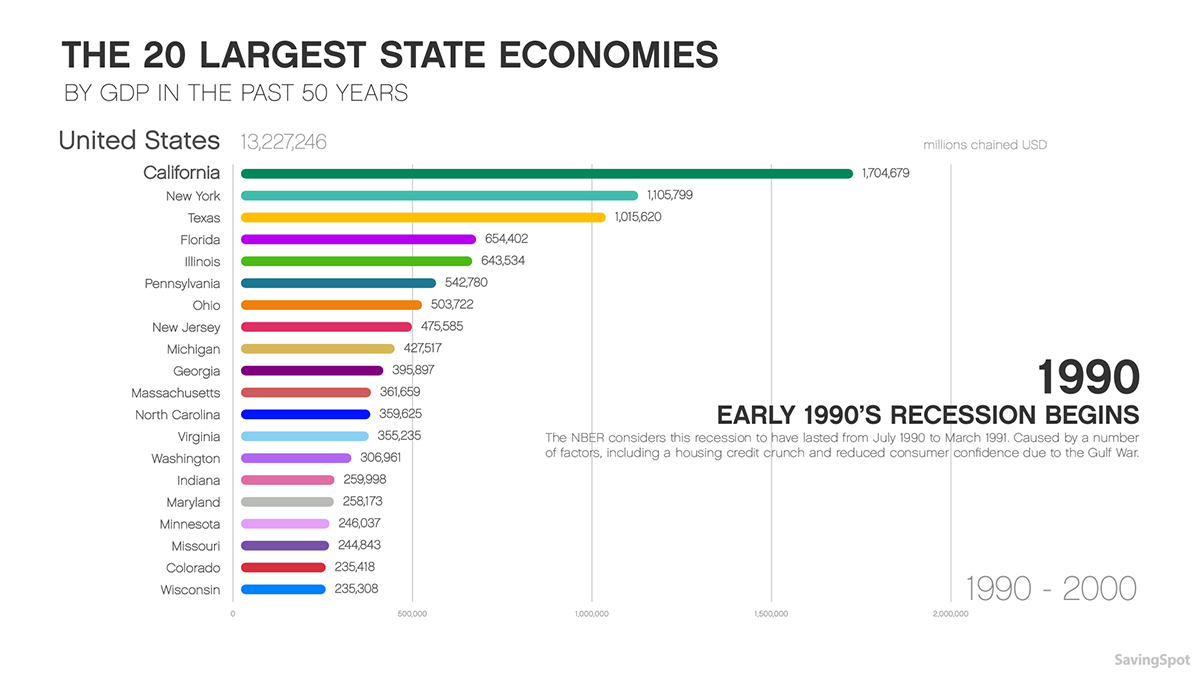
The 1990s began with a recession lasting from July 1990 to March 1991.[15] The recession was caused by a number of factors, including a housing credit crunch and reduced consumer confidence due to the Gulf War.[22] Following the recession, the United States entered the longest period of economic expansion in its history, not experiencing another recession until March 2001.[15] The economic growth was aided in part by the high availability of capital funding and excessive speculation around the burgeoning information technology sector from 1995 to 2000, known as the dot-com bubble.[23]
 2000s – The Great Recession, attacks and decline
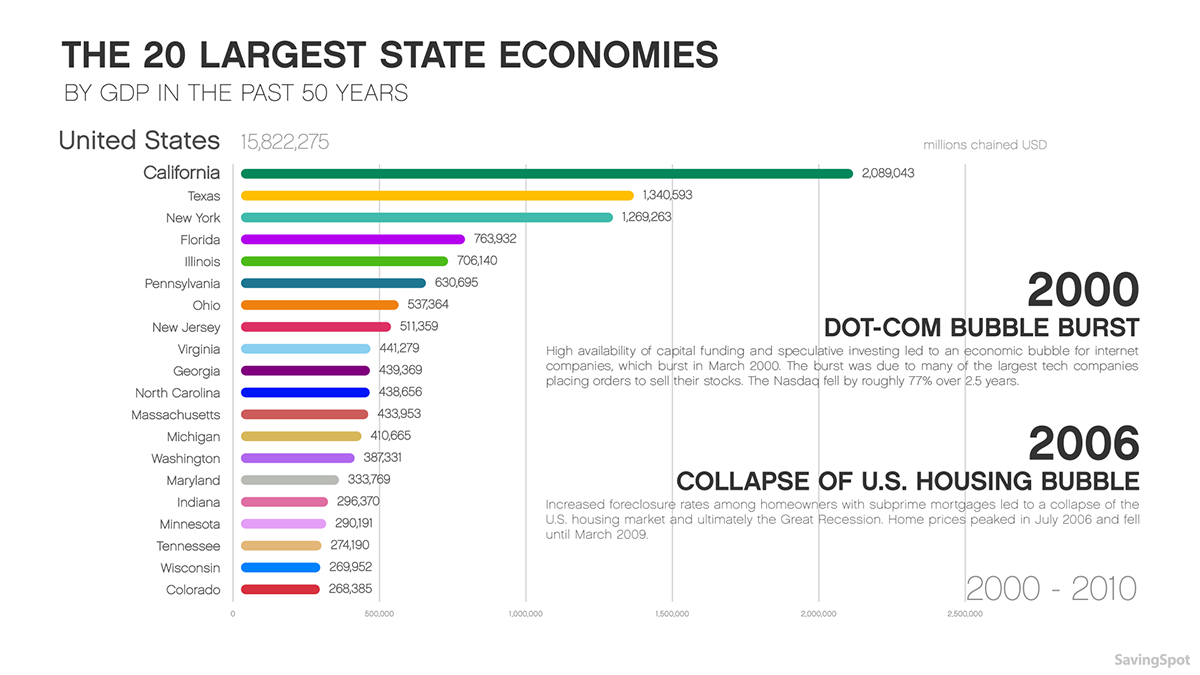
The 2000s were marked by two recessions and the 9/11 terrorist attacks. The first recession was partially caused by the bursting of the dot-com bubble in March 2001 and ended the longest period of economic expansion without a recession in U.S. history.[15],[24] Economic growth was further hindered by the 9/11 terrorist attacks.[25]
The second recession began in December 2007 and lasted to July 2009.[15] The Great Recession was caused by the bursting of the housing bubble in 2006 and the subsequent failures across the banking sector and September 2008 stock market crash.[26] U.S. GDP fell by 2.5% in 2009, the largest decline of the last 50 years.[1] Many states in the Sun Belt, on the heels of rapid population growth, were less affected by the recession than other parts of the country, and experienced relatively strong GDP growth relative to the nation as a whole in the latter half of the decade. In 2006, Texas surpassed New York as the second largest state economy. In 2008, North Carolina entered the top 10 largest states by GDP for the first time.
 2010s – Recovery and uncertainty
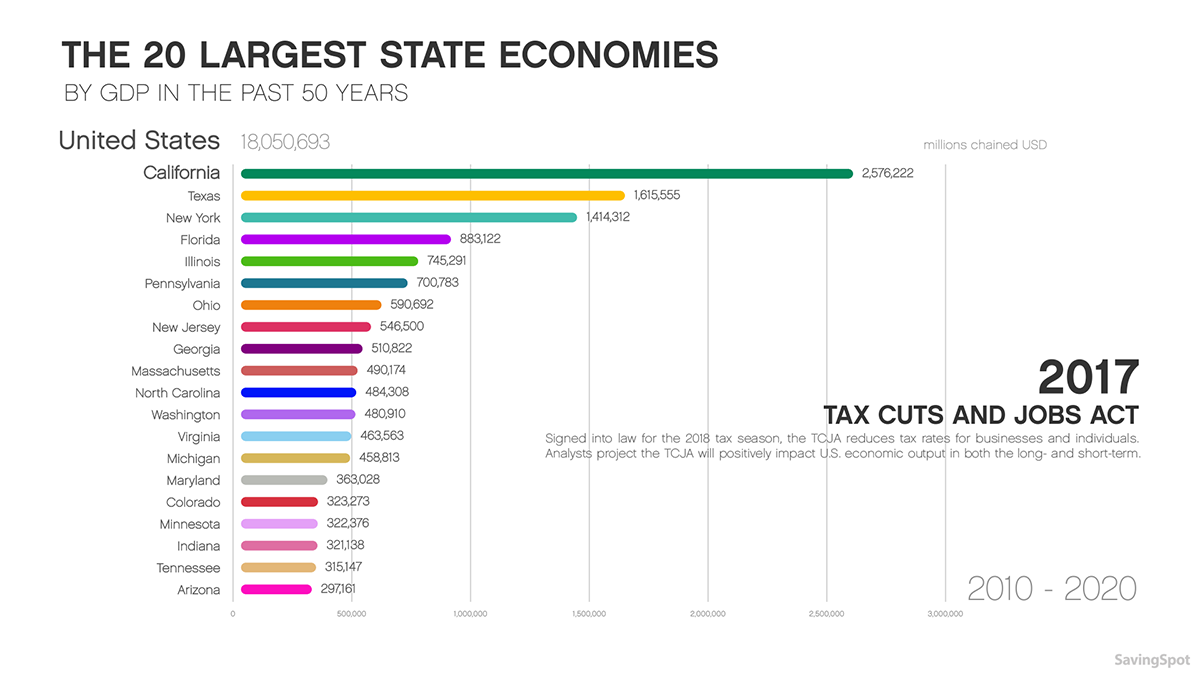
The 2010s have largely been marked by the recovery from the Great Recession and the economic effects of the Trump presidency. Unemployment fell to its lowest point in nearly 50 years in September 2018, and the U.S. is currently experiencing the second-longest period of economic expansion without a recession in its history.[15],[27] Recovery from the Great Recession has been largely uneven throughout the United States, with some parts of the country returning to pre-recessionary unemployment levels far slower than others.[6] Many states in the Northeast and Midwest, such as New York and Illinois, have experienced relatively lackluster GDP growth throughout the decade, while states in the West and South, such as California and Texas, consistently outpace the nation as a whole.
In 2017, President Trump signed into law the Tax Cuts and Jobs Act, effective for the 2018 tax season.[28] The TCJA reduces tax rates for businesses and individual income and, according to most mainstream analysts, will have a modest positive effect on U.S. economic output in the short- and long-term.[29]
A change in economic policy
The U.S. is currently in the midst of its second-longest period of post-recessionary growth, and the annual unemployment rate is at a near 50-year low.[15],[30] While the major economic trends of the last five decades — the shift from manufacturing to services in the domestic economy and a rising wave of globalization in the international economy — have strongly benefited some parts of the country, other states have struggled. In the 2016 election, Donald Trump capitalized on the economic anxiety felt by unemployed and marginalized workers in the Rust Belt and other disenfranchised areas, winning the presidency on an America First platform.[4] While it is too early to determine the economic effects of the Trump presidency, many of his policy principles — protectionist trade policy, lower taxes and the undoing of Obama-era health and environmental policies — mark a sharp turn from economic policy of the last several decades.
METHODOLOGY
To identify the 20 largest state economies of the past 50 years, CashNetUSA used inflation-adjusted GDP figures from the U.S. Bureau of Economic Analysis (BEA). Data for the years 1967-1996 are based on the Standard Industrial Classification (SIC) system and are adjusted for inflation by the BEA using chained 1997 dollars. Data for the years 1997-2017 are based on the North American Industry Classification System (NAICS) and are adjusted for inflation by the BEA using chained 2012 dollars. The discontinuity in the time series, starting in 1997, was minded in our analysis, and comparisons across the two data series were avoided. Intercensal population estimates from the U.S. Census Bureau were used to complement our analysis.
SOURCES
1. U.S. Bureau of Economic Analysis (2019). Table 1.1.6. Real Gross Domestic Product, Chained Dollars. bea.gov
2. U.S. Bureau of Labor Statistics (2019). Employment, Hours, and Earnings from the Current Employment Statistics survey. bls.gov
3. Adler, S. et al. (2014). The Decline of the U.S. Rust Belt: A Macroeconomic Analysis. Center for Quantitative Economic Research Working Paper Series
4. Valli, V. 2018. The American Economy from Roosevelt to Trump. Switzerland: Palgrave Macmillan
5. U.S. Bureau of Economic Analysis (2018). SARPP Regional Price Parities by state. bea.gov
6. U.S. Bureau of Labor Statistics (2019). Local Area Unemployment Statistics. bls.gov
7. U.S. Census Bureau (2019). State Intercensal Tables: 1900-1990. census.gov
8. University of Groningen (n.d.). The Postwar Economy: 1945-1960. let.rug.nl
9. U.S. Bureau of Economic Analysis (2019). Table 1.1.6. Real Gross Domestic Product, Chained Dollars. bea.gov
10. Shackleton, R. (2013). Total Factor Productivity Growth in Historical Perspective cbo.gov
11. University of Groningen (n.d.). The Postwar Economy: 1945-1960. let.rug.nl
12. Bryan, M. (n.d.). The Great Inflation. federalreservehistory.org
13. National Bureau of Economic Research (2012). US Business Cycle Expansions and Contractions. nber.org
14. Marglin, S. and Schor, J. (1991). The Golden Age of Capitalism: Reinterpreting the Postwar Experience. England: Oxford University Press
15. National Bureau of Economic Research (2012). US Business Cycle Expansions and Contractions. nber.org
16. Cándida Smith, R. et al. (2011). Slaying the Dragon of Debt: Fiscal Policy & Politics from the 1970s to the Present; 1973-74 Oil Crisis. bancroft.berkeley.edu
17. Federal Steel Supply, Inc. (2016). How Does The Cost Of Oil Affect The Steel Industry? fedsteel.com
18. Stewart, T. et al. (2014). Surging Steel Imports Put Up To Half a Million U.S. Jobs at Risk. epi.org
19. Cándida Smith, R. et al. (2011). Slaying the Dragon of Debt: Fiscal Policy & Politics from the 1970s to the Present; 1980-82 Early 1980s Recession. bancroft.berkeley.edu
20. The Wall Street Journal. (n.d.). Dow Jones Industrial Average All-Time Largest One Day Gains and Losses. wsj.com
21. Henriques, D. (2017). Those Who Don’t Learn From Financial Crises Are Doomed to Repeat Them. theatlantic.com
22. Cándida Smith, R. et al. (2011). Slaying the Dragon of Debt: Fiscal Policy & Politics from the 1970s to the Present; 1990-92 Early 1990s Recession. bancroft.berkeley.edu
23. Investopedia (2019). Dotcom Bubble. investopedia.com
24. Roberts, E. (n.d.). What happened during the downturn in the 2000s? cs.stanford.edu
25. Roberts, B. (2009). The Macroeconomic Impacts of the 9/11 Attack: Evidence from Real-Time Forecasting. dhs.gov
26. Cándida Smith, R. et al. (2011). Slaying the Dragon of Debt: Fiscal Policy & Politics from the 1970s to the Present; 2007-09 Financial Crisis. bancroft.berkeley.edu
27. U.S. Bureau of Labor Statistics (2019). Labor Force Statistics from the Current Population Survey. bls.gov
28. Pullen, J. (2018). President Trump Has Signed the GOP Tax Bill. Here’s When the Cuts Will Start. fortune.com
29. Tax Policy Center. (n.d.). How might the Tax Cuts and Jobs Act affect economic output?. taxpolicycenter.org
30. U.S. Bureau of Labor Statistics (2019). Labor Force Statistics from the Current Population Survey. Bls.gov