Experts suggest putting aside around 20% of your monthly income and maintaining emergency savings to cover three to six months of expenses. But nearly one in five (18.7%) American households spend their full income as regularly as they earn it, according to the Federal Reserve Bank of St. Louis — so-called hand-to-mouth living. Many are high-earning, high-consumption households, but around one-third may be spending their full income on necessities.
In fact, the Federal Reserve Board found that just 54% of U.S. adults have enough savings to get by if they lose their main source of income. And those with the lowest income and the smallest savings are most vulnerable to changes in their personal circumstances or fluctuations in the economy. For example, while the tariff raises of April ’25 are designed to boost wages and create more American jobs, Yale’s Budget Lab notes that, in general, “tariffs burden households at the bottom of the income ladder more than those at the top as a share of income.”
CashNetUSA is here to help you get your finances on track. That is why we have built a free Monthly Budget Calculator you can use to plan your household spending month on month. Just enter your income and outgoings to see how your lifestyle adds up — and where you might be able to cut back if necessary.
50/30/20 Budget Calculator
The ‘50/30/20 rule’ is a simple way to break down your monthly income into an easily digestible budget.
- 50% of your income should be used for needs. These are expenses you cannot avoid, such as housing costs, bills and food.
- 30% can be spent on wants. These are non-essential items or activities such as entertainment, travel, or subscriptions.
- 20% should go towards savings. This includes adding to your emergency fund, reducing your debts beyond the minimum payments, and saving for retirement.
Our calculator works by comparing your income against your monthly expenses to provide you with an ideal 50/30/20 budget that you can work towards. You can compare your current budget against the ideal 50/30/20 budget to see where you can make changes to your spending.
After you have calculated your budget breakdown, make sure to download your new monthly budget using the button provided. This will give you a spreadsheet you can open in any finance software.
The states and metros with the most disposable income
While building our budget calculator, we decided to dive into the latest MIT and Bureau of Labor Statistics data on cost of living and salaries nationwide to uncover the places around the U.S. with the most and least disposable income. We calculated the difference between the average cost of living and the average salary in every state and metropolitan area around the U.S. Read on to find out where your area appears.
Key findings
- Single people in Washington have an average of $23,301 in expendable income annually — more than in any other state.
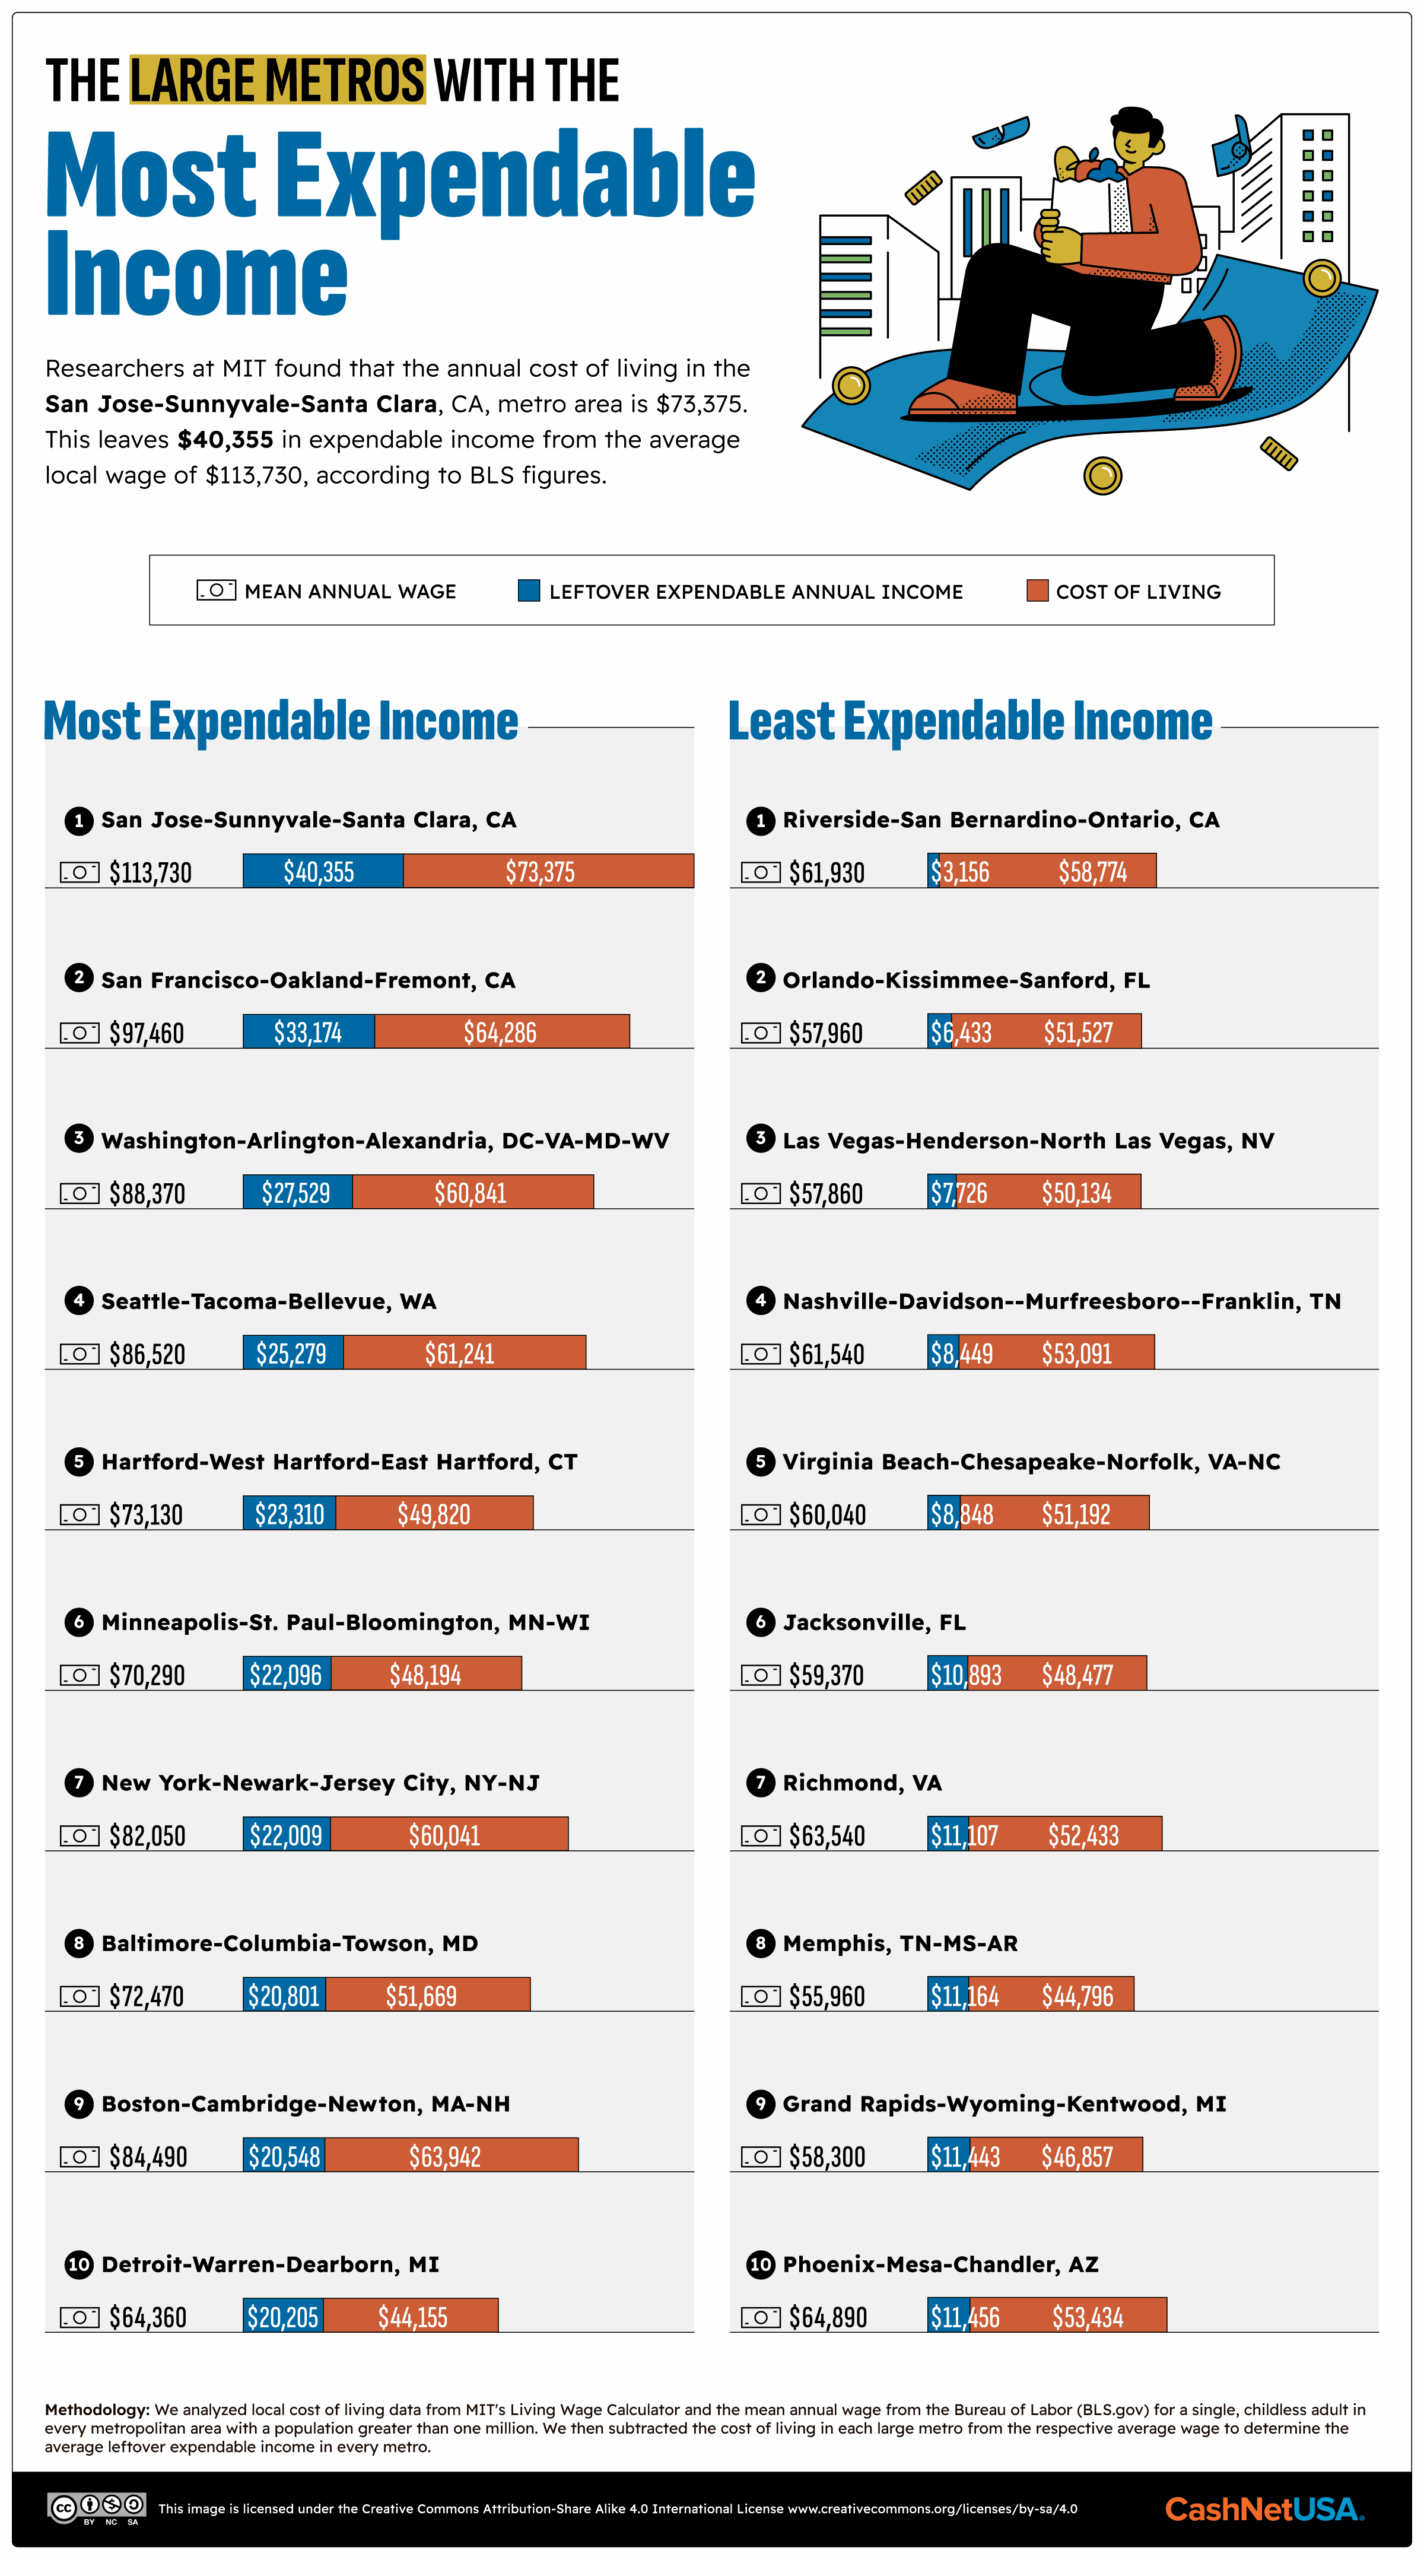
- The metropolitan area where people have the most annual expendable income on average is San Jose-Sunnyvale-Santa Clara, CA ($40,355).
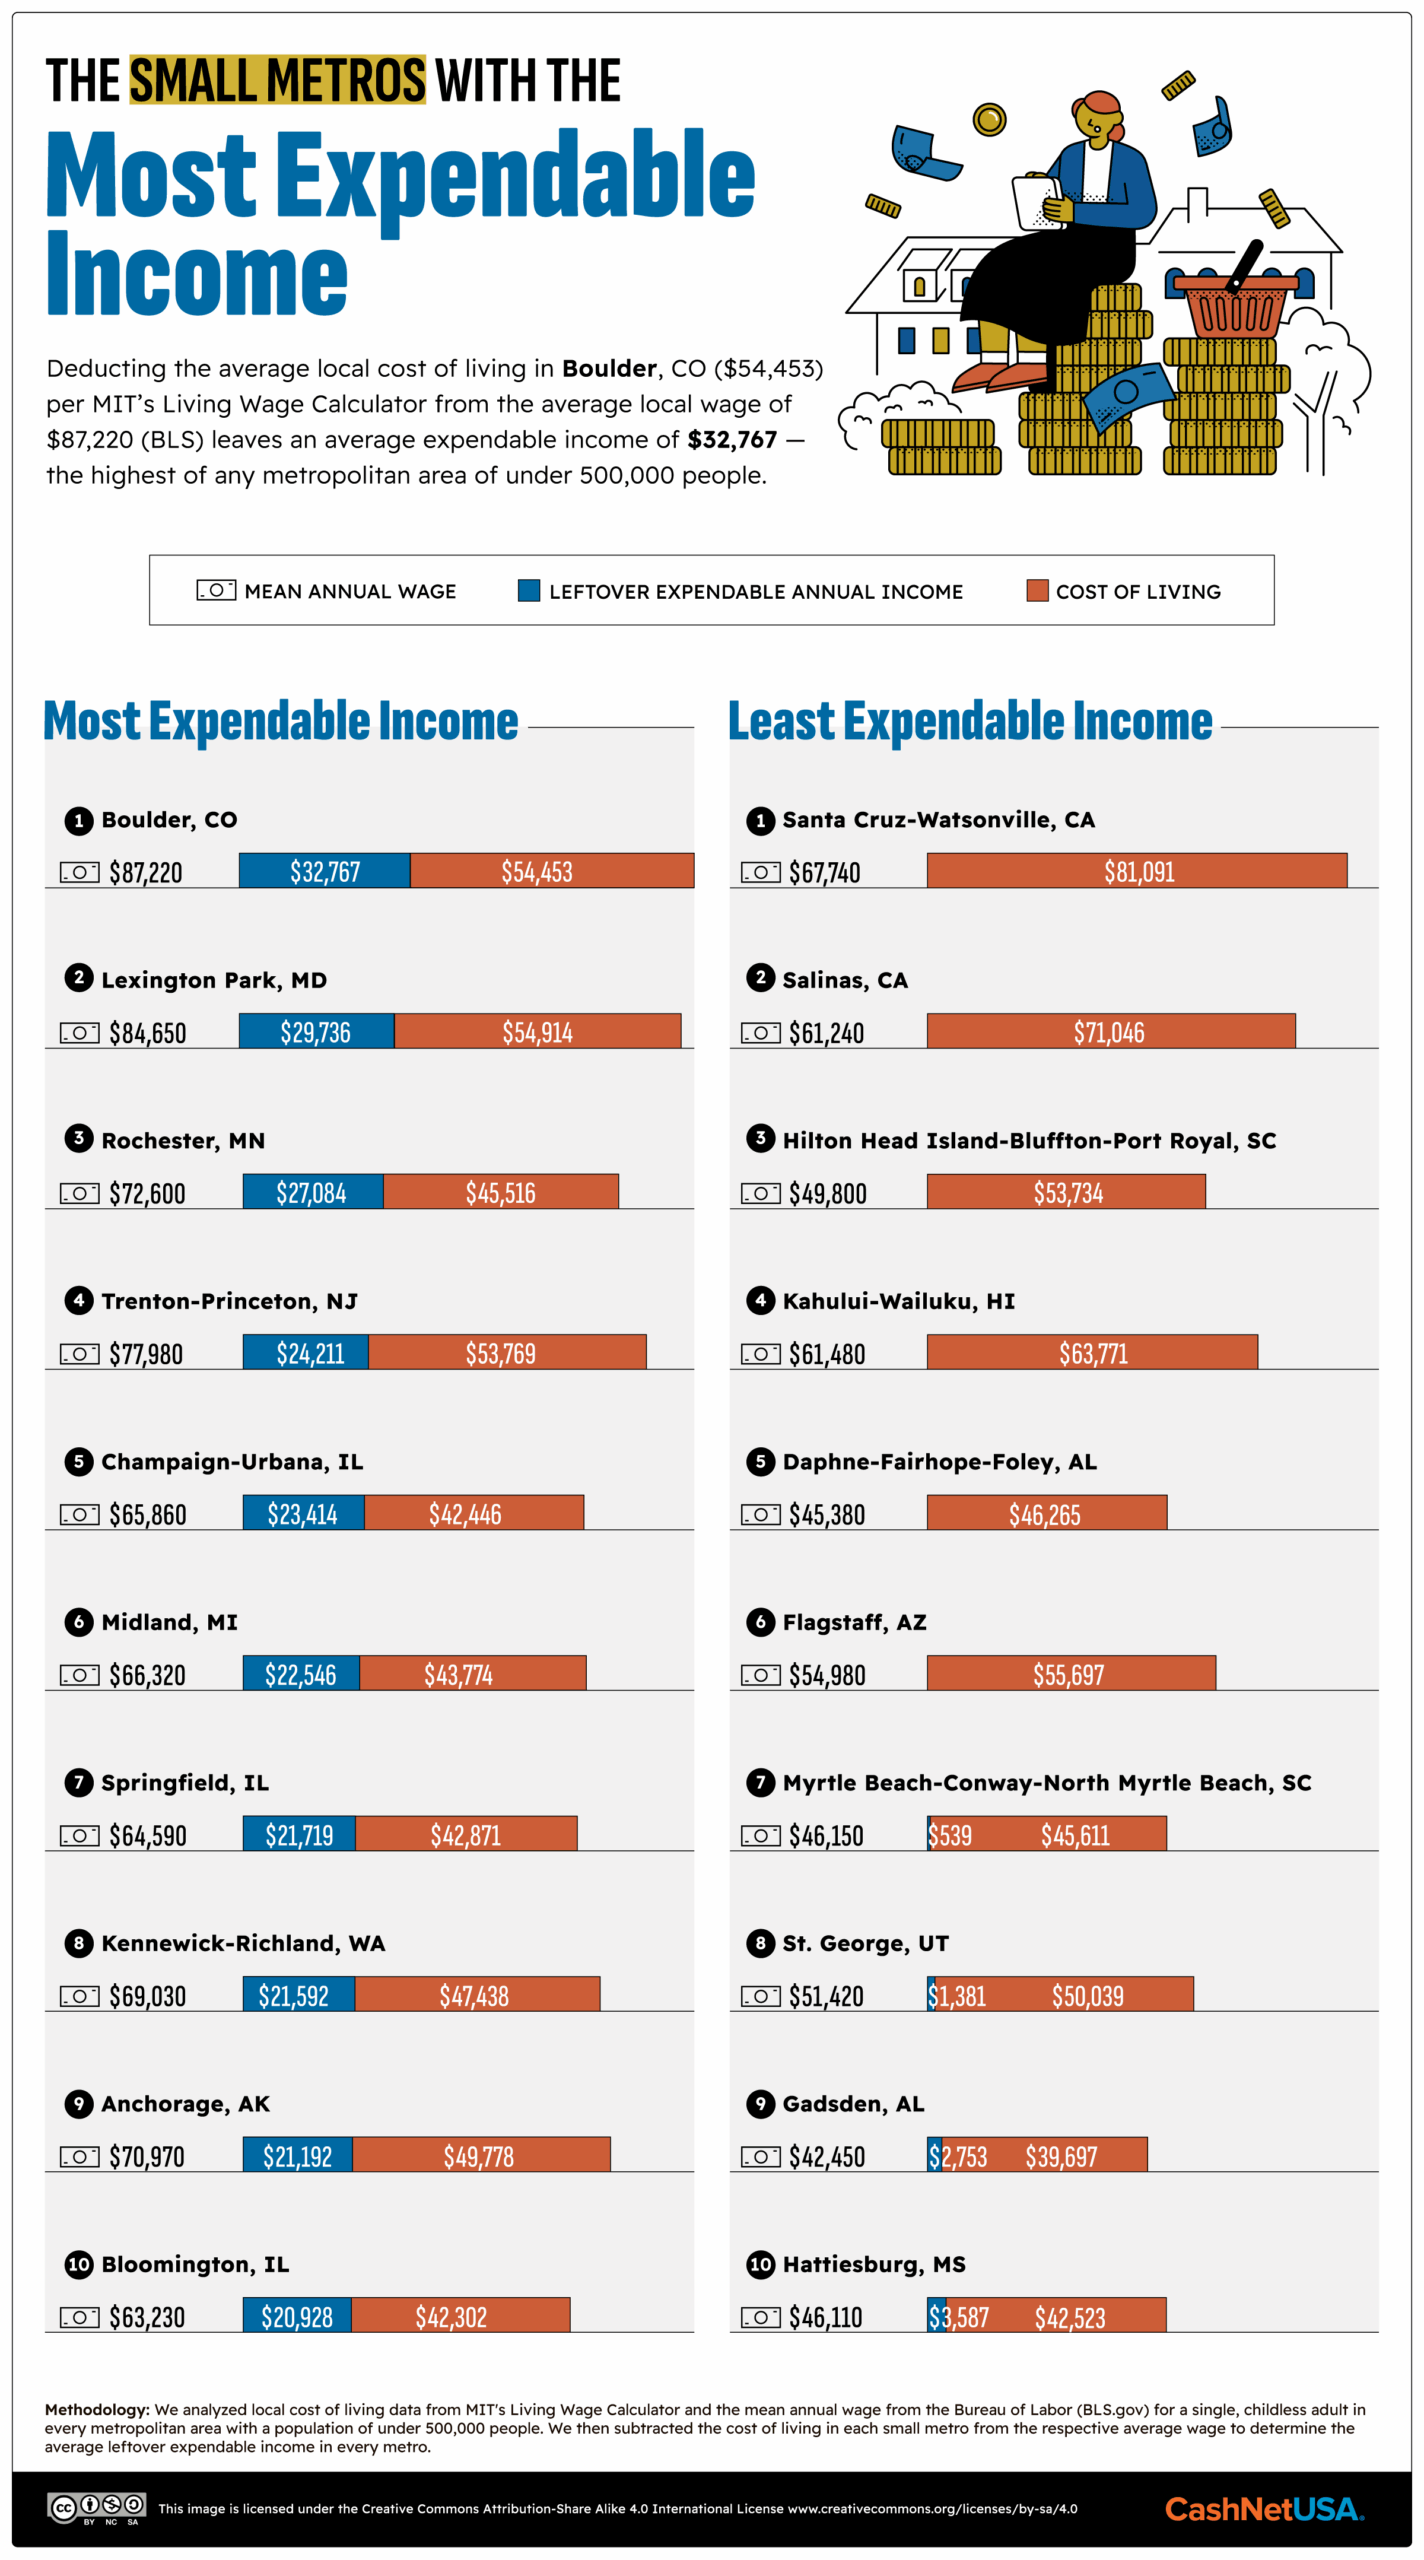
- The metro with the least expendable income is Santa Cruz-Watsonville, CA, where the average annual cost of living is $13,351 more than the average local income.
Washington is the top state for disposable income
The average wage in the state of Washington is $78,130, according to the Bureau of Labor Statistics, while MIT puts the local cost of living at $54,829 per year. This leaves $23,301 in expendable income — the most for any state. Washington has the third-highest income level but only the fifth-highest cost of living, partly due to having no state income tax.
However, young adults say that Washington’s economic success story disproportionately benefits older residents, with spiraling rents preventing single earners from getting on the property ladder. “Costs are too high for basic necessities like housing and groceries,” acknowledges State Governor Bob Ferguson. “We need to expand access to workforce training and apprenticeship programs that help young people transition into good-wage jobs as well as make college affordable and accessible for all who want it.”
 Mississippi is the state with the lowest average income. Its average expendable income is just $4,411 per year, the second lowest of any state, and just one-fifth of the average in Washington.
But the lowest figure of all belongs to Hawaii. Despite an average salary of $65,030, Hawaiians make do with an average of just $2,797 in expendable income, thanks to the highest tax and grocery bills in America and housing costs that are second only to California’s. A plan to raise the cut-off of the top state income bracket was actioned in 2024, aiming to take advantage of billion-dollar surpluses while shifting the tax burden to those who can afford it.
Large Californian metropolitan areas are among the best and worst for disposable income
Next, we looked at metropolitan areas with a population of over one million. The large metro with the highest expendable income is San Jose-Sunnyvale-Santa Clara in California, where the average wage of $113,730 leaves an expendable income of $40,355 — despite a cost of living ($73,375) that is unrivaled by any other large metro.
Housing and taxes account for San Jose-Sunnyvale-Santa Clara’s high cost of living, which is 14.1% higher than neighboring San Francisco-Oakland-Fremont but still enjoys expendable income levels of 21.7% higher than the latter. Around 40% of San Jose-Sunnyvale-Santa Clara’s population live in upper-income households, according to the Pew Research Center.

Away from the high disposable incomes of San Jose and San Francisco, California’s Riverside-San Bernardino-Ontario area has the lowest expendable income ($3,156) of any large metro. This is only around half the figure of the second-lowest-ranked metro, Orlando-Kissimmee-Sanford, FL ($6,433). Riverside-San Bernardino-Ontario has the joint highest homeowner cost burden among the biggest metro areas. Upwards of 400,000 locals are eligible for support from CalFresh, the state’s take on the federal Supplemental Nutrition Assistance Program.
Bridgeport, CT, pairs high salaries with reasonable housing costs
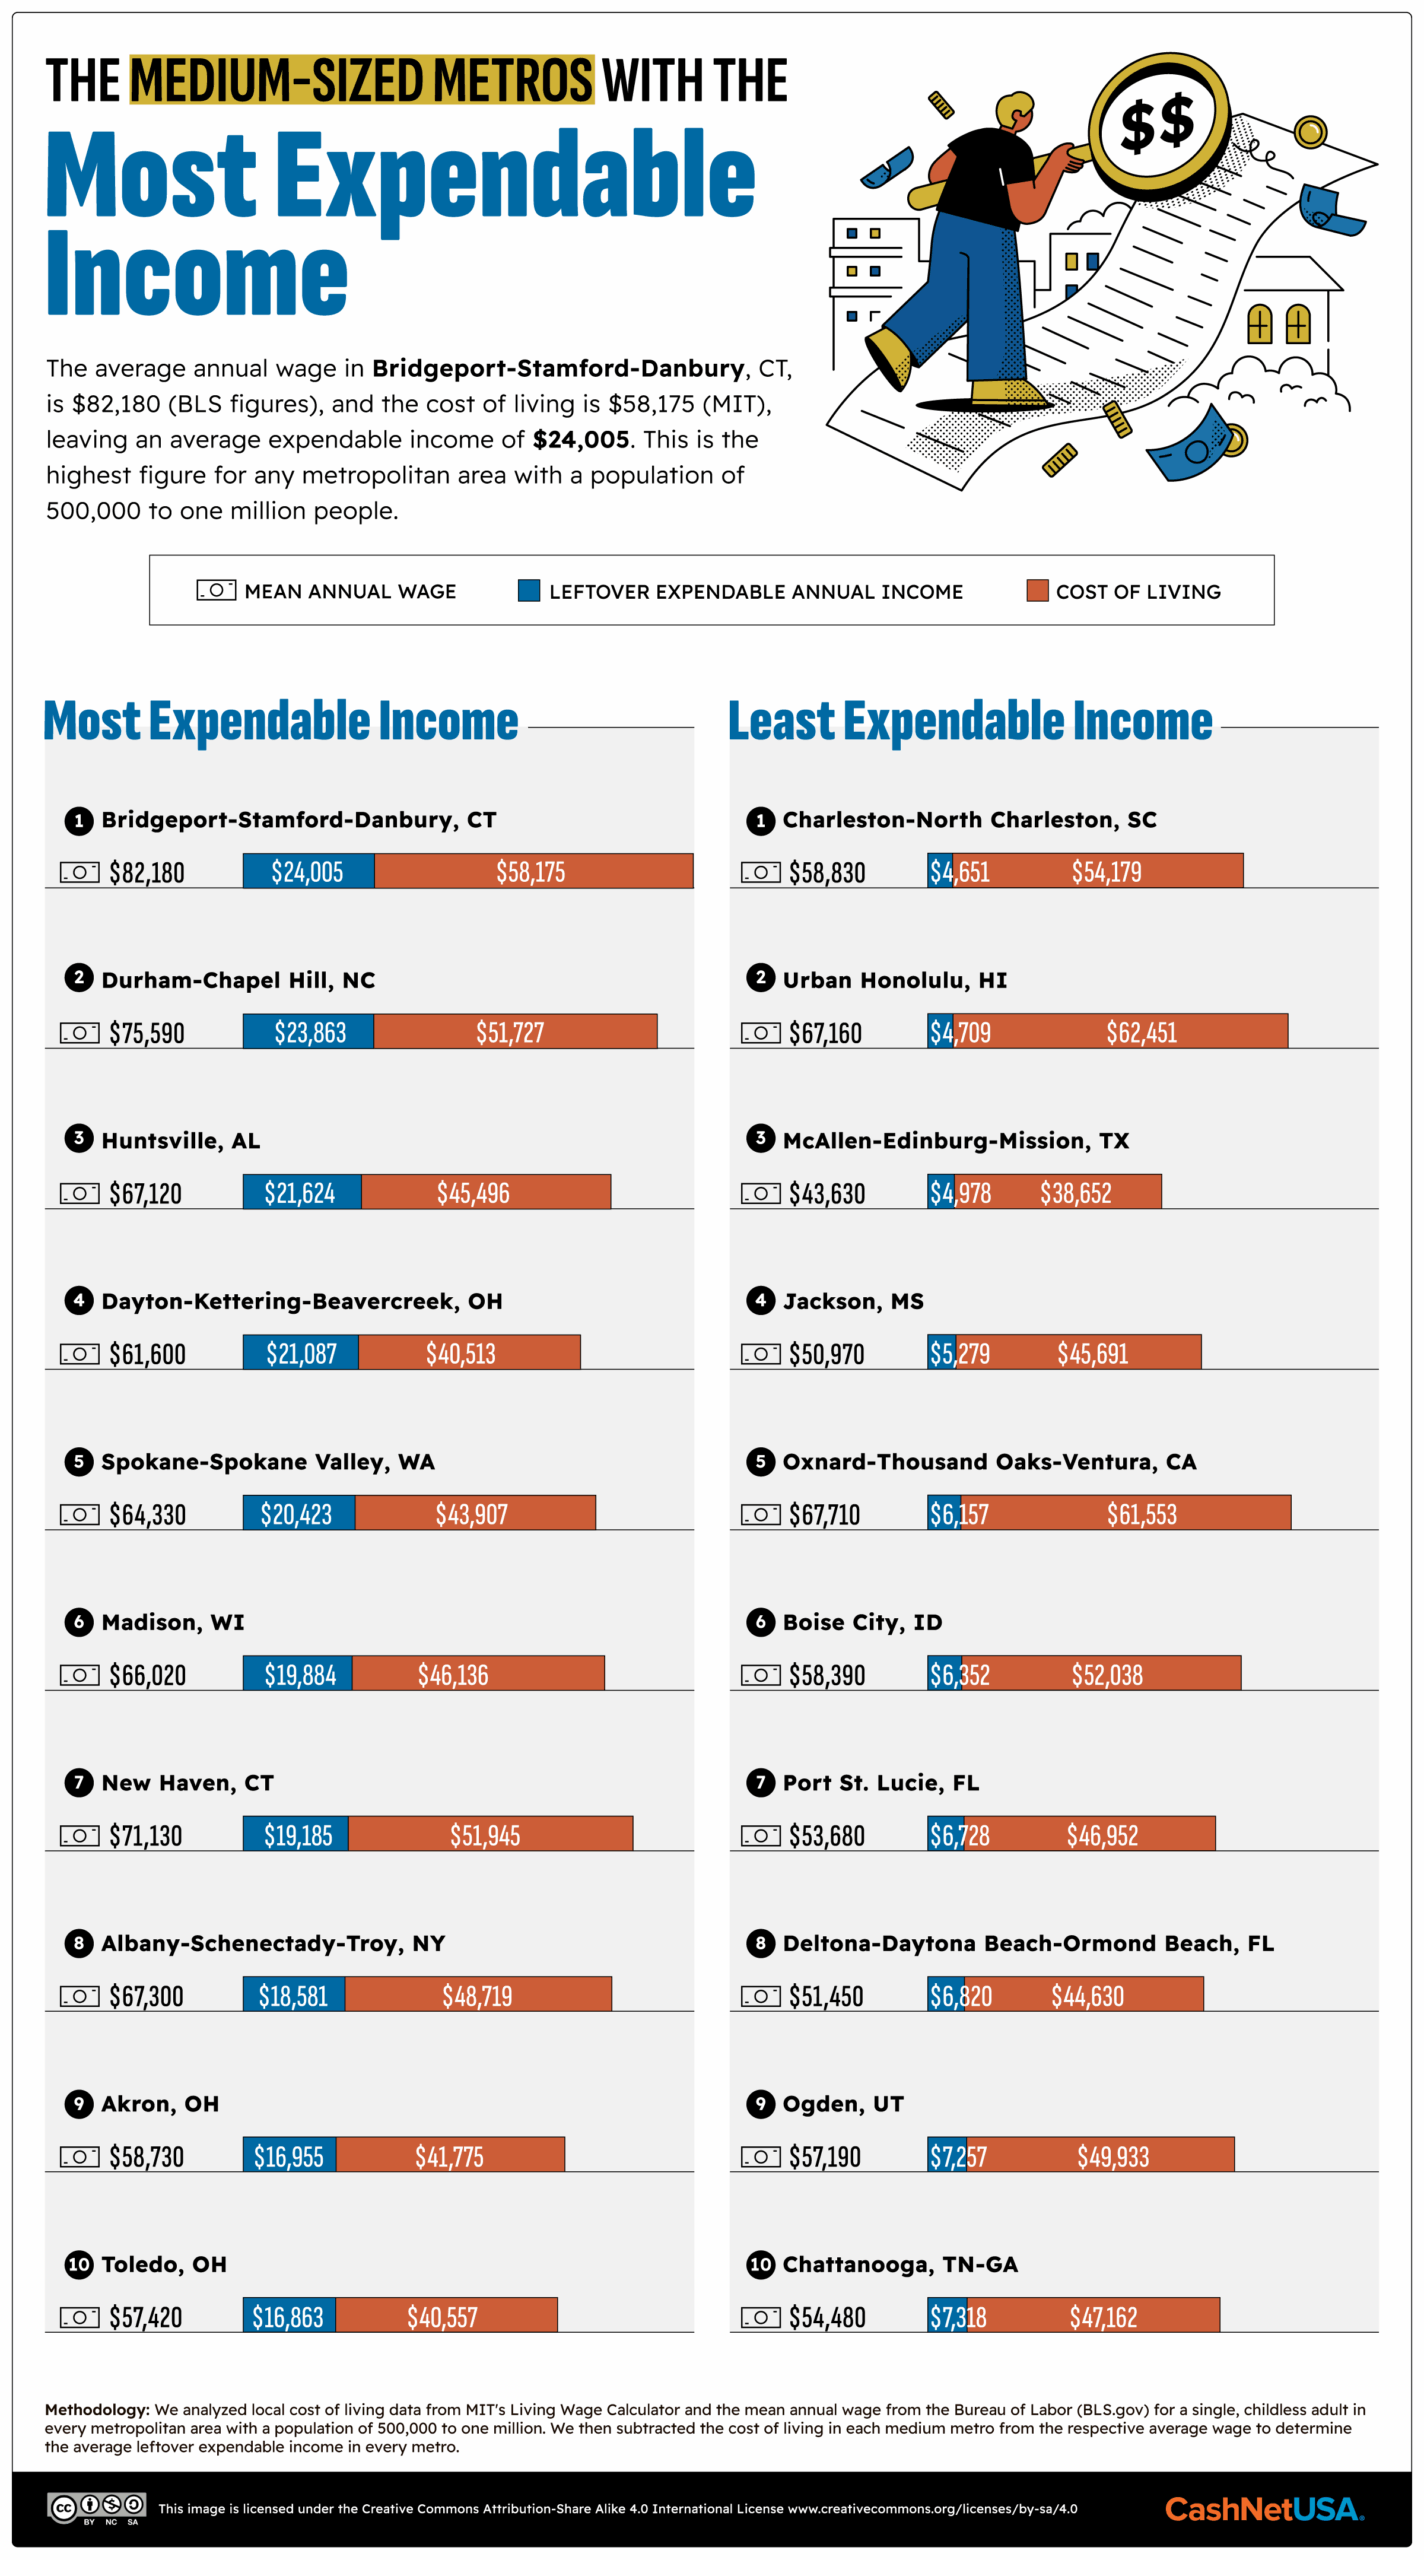
Among medium-sized metros of 500,000-one million population, Bridgeport-Stamford-Danbury, CT, has the highest average expendable income: $24,005. Around 35% of Connecticut households spend more than 30% of their income on rent or mortgage payments. Still, the average salary in this metro area is $82,180, and the cost of housing is low compared to other areas with similar income levels.
Among medium-sized metros of 500,000-one million population, Bridgeport-Stamford-Danbury, CT, has the highest average expendable income: $24,005. Around 35% of Connecticut households spend more than 30% of their income on rent or mortgage payments. Still, the average salary in this metro area is $82,180, and the cost of housing is low compared to other areas with similar income levels.

The cost of living in Bridgeport-Stamford-Danbury ($58,175) is just a few hundred dollars less than the full average income in Charleston-North Charleston, SC ($58,830) — and the cost of living in the latter is not much less ($54,179). This leaves the Charleston metro area with an average expendable income of just $4,651.
On the bright side, it’s cheaper than NYC: as one new arrival notes, the warmer weather means cheap or free outdoor activities (such as the beach) while luxuries such as the cinema can cost a fraction of the price. “I no longer live paycheck to paycheck like in NYC,” she told Fast Company.
The average Santa Cruz income does not cover local costs
Finally, we looked at small metro areas — those with a population lower than 500,000. The metro of Boulder, CO, has the highest average level of expendable income, with the average salary of $87,220 covering the $54,453 cost of living by $32,767. However, income disparity means that many lower earners have struggled to keep up as Boulder County healthcare costs have risen by 180%, childcare bills have doubled, and housing has risen by 80% since the turn of the millennium.
“Until we solve systemic issues and have livable wages, we are going to keep losing our middle households — teachers, firefighters, baristas, cashiers,” said Jennifer Banyan, Community Foundation Boulder County, in 2023. If these families don’t earn livable wages somehow, we won’t have a healthy community.”

Average local wages outweigh the regional cost of living in the large and medium metros that we surveyed. However, among the smallest, we found six areas where local incomes do not cover expenses. The most profound of these shortfalls is Santa Cruz-Watsonville, CA, where the mean annual wage of $67,740 falls -$13,351 short of the $81,091 in expenses that locals can expect to face. This is largely due to housing costs, which — at an average of $36,826 in annual rent or mortgage payments — eclipse those of every other metro area featured in our study.
Thousands of affordable homes are being built, but it will take time for their effect to be felt in the housing market. In the meantime, “More and more people I talk to are living in fear, because they’re living paycheck to paycheck and making difficult decisions every day,” says Elaine Johnson, Executive Director of Housing Santa Cruz County. “‘Do I eat? Or do I pay the landlord?’”
How to make the most of your disposable income
Putting money aside can sometimes feel like something “other people” do. But, taking proactive measures to make the most of your paycheck can help you take control of your income and enjoy your earnings.
1. Start small.
Establish a secondary bank account, such as a High-Yield Savings Account, to ringfence your savings and put something in it immediately, even if it’s only a few dollars. This helps establish a saving mindset and gets you on the road to becoming a saver.
2. Track your spending.
If you pay for everything using a bank card, it is straightforward to add up everything you’ve spent over the past month using your bank statement. If not, make a written note every time you pay in cash for one month.
3. Audit your costs.
Establish the categories (e.g., groceries, entertainment) where you spend the most and highlight potential areas of saving. Look into switching utility providers, cellphone plans, etc., to reduce your monthly bills.
4. Create a budget.
Using the details you found when tracking your spending (above), allocate a percentage of your monthly income to each category and stick to it. Ensure to include a column for “savings” and one for “treats.” Automate the transfer of your planned monthly savings to take place right after payday each month.
5. Allow for irregular bills.
Birthdays, car repairs and home maintenance bills can seem to jump out of nowhere. Figure out annual costs for each category of unexpected costs and divide this over the year, putting aside a percentage of your monthly income into an emergency fund.
These steps will show just how much of your income is truly expendable and to make the most of it.
Disposable income for working families
U.S. household net worth reached a new high in 2024, and the proportion of Americans living hand-to-mouth has fallen over the past decade. But many working families may not notice, as government figures show much of this money has gone to the richest households, boosting wealth disparity.
And, as University of Michigan economist Joanne Hsu notes, “a 10 percent boost to middle and especially higher incomes is money that feels real, like you can do something with it.” In contrast, the same percentage for somebody on minimum wage works out at less than ten dollars per day. This is why it takes careful budgeting to convert avoidable expenses into potential expendable income — and make the most of every cent.
Methodology
To find out which states and metropolitan areas have the most expendable income on average, we looked at cost of living data from MIT’s Living Wage Calculator (https://livingwage.mit.edu/) and average wages by metros from the Bureau of Labor (BLS.gov).
From the MIT dataset, we identified the yearly income required for one adult (with zero children) in each state and metro, broken down into the following metrics:
- Food
- Housing
- Medical
- Transportation
- Civic
- Internet & Mobile
- Annual Taxes
- Other
For each state and metro, we then subtracted the cost of living from the mean annual wage to determine the average leftover expendable income.
Data is correct as of March 2025.
DISCLAIMER: This content is for informational purposes only and should not be considered financial, investment, tax or legal advice.


